|
Download Data (XLS File) |
|
||||||||
|
||||||||
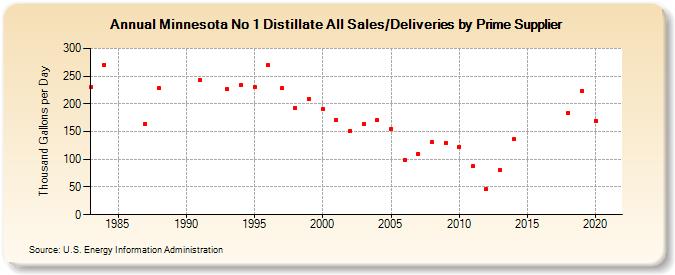
| Minnesota No 1 Distillate All Sales/Deliveries by Prime Supplier (Thousand Gallons per Day) | ||||||||
| Decade | Year-0 | Year-1 | Year-2 | Year-3 | Year-4 | Year-5 | Year-6 | Year-7 | Year-8 | Year-9 |
|---|---|---|---|---|---|---|---|---|---|---|
| 1980's | 230.6 | 270.7 | W | W | 164.1 | 227.9 | W | |||
| 1990's | W | 243.4 | W | 226.3 | 233.4 | 230.8 | 269.5 | 227.8 | 193.0 | 209.6 |
| 2000's | 191.0 | 170.7 | 151.7 | 163.4 | 170.5 | 155.2 | 98.3 | 110.1 | 131.1 | 130.0 |
| 2010's | 122.7 | 87.4 | 46.5 | 81.4 | 136.5 | W | W | W | 183.7 | 223.6 |
| 2020's | 169.5 |
| - = No Data Reported; -- = Not Applicable; NA = Not Available; W = Withheld to avoid disclosure of individual company data. |
| Release Date: 6/1/2022 |
| Next Release Date: TBD |