|
Download Data (XLS File) |
|
||||||||
|
||||||||
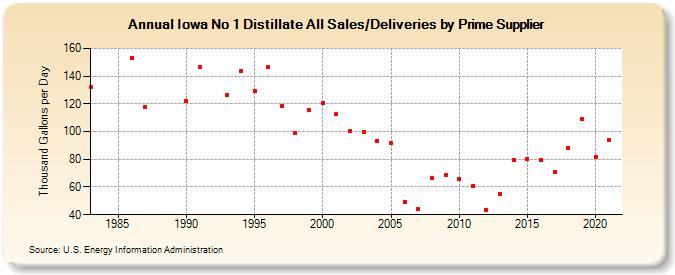
| Iowa No 1 Distillate All Sales/Deliveries by Prime Supplier (Thousand Gallons per Day) | ||||||||
| Decade | Year-0 | Year-1 | Year-2 | Year-3 | Year-4 | Year-5 | Year-6 | Year-7 | Year-8 | Year-9 |
|---|---|---|---|---|---|---|---|---|---|---|
| 1980's | 132.0 | W | W | 152.9 | 117.8 | W | W | |||
| 1990's | 121.8 | 146.8 | W | 126.7 | 144.0 | 129.6 | 146.5 | 118.6 | 99.1 | 115.2 |
| 2000's | 120.4 | 112.5 | 100.5 | 99.7 | 93.2 | 91.6 | 49.5 | 44.2 | 66.7 | 68.5 |
| 2010's | 65.5 | 61.0 | 43.3 | 55.2 | 79.4 | 80.2 | 79.8 | 71.0 | 88.0 | 108.9 |
| 2020's | 81.3 |
| - = No Data Reported; -- = Not Applicable; NA = Not Available; W = Withheld to avoid disclosure of individual company data. |
| Release Date: 6/1/2022 |
| Next Release Date: TBD |