|
Download Data (XLS File) |
|
||||||||
|
||||||||
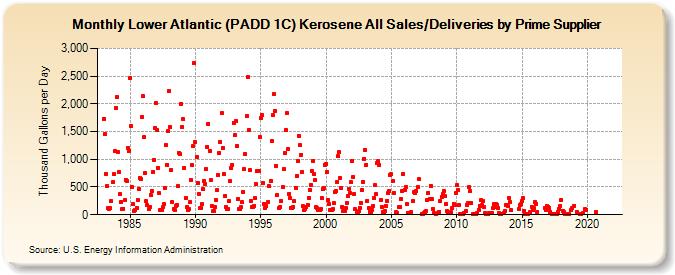
| Lower Atlantic (PADD 1C) Kerosene All Sales/Deliveries by Prime Supplier (Thousand Gallons per Day) | ||||||||
| Year | Jan | Feb | Mar | Apr | May | Jun | Jul | Aug | Sep | Oct | Nov | Dec |
|---|---|---|---|---|---|---|---|---|---|---|---|---|
| 1983 | 1,732.9 | 1,455.0 | 742.1 | 515.5 | 112.9 | 102.9 | 113.7 | 245.0 | 583.3 | 725.9 | 1,141.9 | 1,921.9 |
| 1984 | 2,122.9 | 1,132.3 | 767.2 | 365.5 | 227.8 | 98.7 | 108.5 | 262.0 | 631.2 | 606.2 | 1,204.6 | 1,146.5 |
| 1985 | 2,457.8 | 1,598.2 | 491.4 | 187.6 | 70.1 | 81.7 | 125.4 | 271.0 | 464.8 | 655.5 | 651.9 | 1,763.6 |
| 1986 | 2,134.3 | 1,396.4 | 753.0 | 238.9 | 167.0 | 99.0 | 145.7 | 352.5 | 436.1 | 777.0 | 990.7 | 1,561.8 |
| 1987 | 2,008.6 | 1,527.8 | 850.9 | 385.7 | 86.8 | 81.6 | 134.1 | 189.8 | 485.9 | 1,255.8 | 902.4 | 1,505.9 |
| 1988 | 2,232.1 | 1,579.9 | 811.0 | 220.5 | 104.4 | 76.3 | 165.2 | 184.0 | 515.7 | 1,121.8 | 1,086.9 | 2,001.9 |
| 1989 | 1,585.5 | 1,717.8 | 847.1 | 304.2 | 131.0 | 83.0 | 98.4 | 228.5 | 630.2 | 894.5 | 1,232.5 | 2,728.2 |
| 1990 | 1,303.6 | 1,049.5 | 577.4 | 378.0 | 113.4 | 119.7 | 184.4 | 463.2 | 604.6 | 560.0 | 826.7 | 1,226.7 |
| 1991 | 1,643.4 | 1,151.8 | 621.6 | 154.8 | 60.2 | 64.2 | 135.3 | 264.9 | 442.6 | 712.1 | 1,113.4 | 1,318.9 |
| 1992 | 1,828.0 | 1,207.8 | 734.4 | 339.1 | 140.8 | 99.0 | 109.3 | 239.7 | 599.6 | 844.5 | 898.4 | 1,659.3 |
| 1993 | 1,428.9 | 1,692.8 | 1,235.2 | 280.8 | 106.0 | 99.4 | 137.3 | 223.0 | 412.2 | 818.9 | 1,092.6 | 1,775.5 |
| 1994 | 2,481.5 | 1,528.4 | 803.5 | 249.1 | 144.6 | 146.6 | 164.4 | 297.9 | 551.7 | 785.0 | 795.0 | 1,409.8 |
| 1995 | 1,740.0 | 1,794.1 | 569.0 | 201.5 | 125.5 | 150.5 | W | 231.1 | 512.4 | 612.7 | 1,325.9 | 1,791.7 |
| 1996 | 2,173.6 | 1,869.5 | 886.6 | 351.6 | W | 112.1 | 143.2 | 247.1 | 495.7 | 822.5 | 1,114.5 | 1,523.9 |
| 1997 | 1,832.5 | 1,192.0 | 380.3 | 302.3 | 126.4 | 123.3 | 141.2 | 245.0 | 489.4 | 706.4 | 975.3 | 1,425.0 |
| 1998 | 1,248.6 | 1,084.4 | 768.0 | 148.2 | 89.6 | 110.0 | 134.2 | 177.9 | 307.4 | 437.0 | 543.2 | 786.7 |
| 1999 | 975.6 | 726.3 | 630.3 | 137.1 | 114.8 | 93.2 | 88.5 | 100.9 | 304.0 | 461.6 | 481.9 | 900.9 |
| 2000 | 922.0 | 767.3 | 269.9 | 192.8 | 91.0 | 82.0 | 97.5 | 205.9 | 408.3 | 420.3 | 592.9 | 1,051.8 |
| 2001 | 1,126.2 | 655.9 | 490.0 | 141.2 | 70.5 | 69.7 | 122.8 | 214.1 | 336.4 | 471.0 | 396.6 | 584.7 |
| 2002 | 971.6 | 679.0 | 374.9 | 97.5 | 55.9 | 44.9 | 65.9 | 129.5 | 217.1 | 449.0 | 594.1 | 1,013.3 |
| 2003 | 1,163.2 | 897.2 | 256.3 | 120.4 | 53.6 | 56.2 | 90.9 | 165.7 | 305.9 | 527.7 | 371.4 | 928.5 |
| 2004 | 962.4 | 896.1 | 262.8 | 141.1 | 40.6 | 39.9 | 64.0 | 166.1 | 252.3 | 390.6 | 434.6 | 718.6 |
| 2005 | 729.4 | 602.0 | 398.9 | W | 43.3 | 28.9 | W | 131.7 | 142.9 | 290.9 | 436.4 | 739.3 |
| 2006 | 450.3 | 497.3 | 191.8 | 39.9 | 33.0 | 33.0 | 52.8 | W | 252.0 | 401.0 | 393.9 | 429.2 |
| 2007 | 491.1 | 642.5 | W | W | 21.0 | 19.3 | 36.6 | 51.0 | 69.7 | 274.4 | 398.4 | 287.6 |
| 2008 | 522.5 | 276.4 | 107.3 | 29.1 | W | 15.5 | W | 30.7 | 53.5 | 245.8 | 325.2 | 374.0 |
| 2009 | 428.5 | 332.6 | 186.1 | 67.2 | 30.2 | 29.5 | 38.1 | 41.8 | 113.7 | 192.2 | 181.7 | 392.8 |
| 2010 | 533.3 | 451.1 | 168.4 | 13.6 | 15.4 | 11.5 | 21.2 | 39.3 | 63.1 | 180.8 | 206.3 | 493.2 |
| 2011 | 424.9 | 219.5 | NA | 16.8 | 8.5 | 4.7 | 9.7 | 33.0 | 90.8 | 160.3 | 257.5 | 167.1 |
| 2012 | 247.5 | 140.0 | 28.0 | 9.0 | 4.5 | 7.7 | 22.5 | 23.3 | 39.7 | 114.7 | 192.3 | 142.4 |
| 2013 | 194.5 | 180.8 | 121.7 | 25.0 | 10.3 | 4.6 | W | 31.4 | 66.6 | 173.0 | 177.2 | 165.4 |
| 2014 | 294.0 | 228.5 | 84.4 | W | W | W | W | W | W | 107.8 | 171.6 | 197.0 |
| 2015 | 252.6 | 293.6 | 74.2 | 9.7 | 6.7 | 7.0 | W | 48.2 | W | 142.3 | 86.1 | 114.3 |
| 2016 | 228.5 | 201.9 | 55.7 | W | W | W | W | W | W | 117.7 | 79.4 | 154.6 |
| 2017 | 144.6 | 119.3 | 53.5 | 9.2 | 5.9 | 6.9 | 6.5 | 14.1 | 19.7 | 51.5 | 109.6 | 158.5 |
| 2018 | 267.7 | 70.8 | 56.9 | 20.0 | W | 5.2 | W | 16.1 | W | 85.1 | 117.7 | W |
| 2019 | 165.8 | W | 53.9 | W | W | 6.9 | 8.1 | W | 23.2 | W | 96.6 | 93.4 |
| 2020 | W | W | W | W | W | W | W | W | 41.5 | W | W | W |
| 2021 | W | W | W | W | W | W | W | W | W | W | W | W |
| 2022 | W | W | W | |||||||||
| - = No Data Reported; -- = Not Applicable; NA = Not Available; W = Withheld to avoid disclosure of individual company data. |
| Release Date: 5/19/2022 |
| Next Release Date: TBD |