|
Download Data (XLS File) |
|
||||||||
|
||||||||
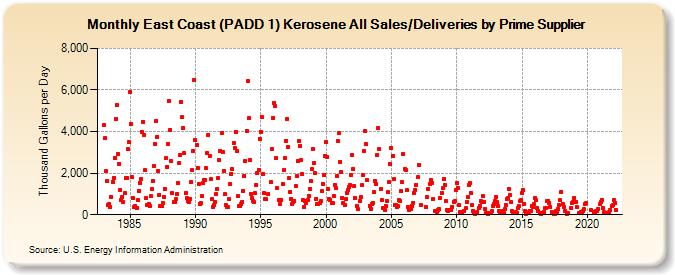
| East Coast (PADD 1) Kerosene All Sales/Deliveries by Prime Supplier (Thousand Gallons per Day) | ||||||||
| Year | Jan | Feb | Mar | Apr | May | Jun | Jul | Aug | Sep | Oct | Nov | Dec |
|---|---|---|---|---|---|---|---|---|---|---|---|---|
| 1983 | 4,319.3 | 3,674.5 | 2,083.6 | 1,604.5 | 467.0 | 526.6 | 380.0 | 860.3 | 1,572.1 | 1,780.2 | 2,715.9 | 4,616.8 |
| 1984 | 5,259.7 | 2,925.0 | 2,451.3 | 1,201.0 | 708.1 | 873.6 | 609.5 | 1,021.3 | 1,755.6 | 1,780.8 | 3,141.6 | 3,506.6 |
| 1985 | 5,921.8 | 4,376.8 | 1,821.6 | 803.1 | 347.1 | 403.4 | 317.1 | 694.6 | 1,154.0 | 1,539.4 | 1,722.6 | 3,995.8 |
| 1986 | 4,463.3 | 3,845.7 | 2,132.4 | 805.7 | 452.0 | 533.6 | 438.3 | 896.6 | 1,224.5 | 1,643.9 | 2,366.9 | 3,414.5 |
| 1987 | 4,520.3 | 3,742.8 | 2,112.5 | 969.1 | 443.0 | 442.1 | 569.0 | 874.0 | 1,251.8 | 2,708.5 | 2,315.5 | 3,420.3 |
| 1988 | 5,461.7 | 4,077.6 | 2,572.7 | 1,022.4 | 606.6 | 607.7 | 737.4 | 994.8 | 1,548.3 | 2,501.8 | 2,884.5 | 5,440.1 |
| 1989 | 4,684.3 | 4,176.1 | 2,967.6 | 1,048.8 | 787.4 | 646.0 | 587.7 | 766.7 | 1,585.1 | 2,150.4 | 3,048.6 | 6,485.6 |
| 1990 | 3,570.6 | 3,350.5 | 2,240.0 | 1,457.5 | 538.8 | 551.8 | 882.3 | 1,546.7 | 1,671.4 | 1,665.1 | 2,226.0 | 2,957.7 |
| 1991 | 3,854.4 | 2,848.1 | 1,699.4 | 742.9 | 375.6 | 446.3 | 614.9 | 986.2 | 1,249.0 | 1,763.0 | 2,624.5 | 3,085.7 |
| 1992 | 3,923.8 | 3,021.9 | 2,119.7 | 973.2 | 478.9 | 353.3 | 355.9 | 745.1 | 1,485.8 | 1,961.9 | 2,181.7 | 3,460.6 |
| 1993 | 3,231.7 | 3,993.9 | 3,067.6 | 888.4 | 406.5 | 423.9 | 507.8 | 634.1 | 1,152.7 | 1,864.7 | 2,567.5 | 4,042.9 |
| 1994 | 6,431.1 | 4,635.1 | 2,633.1 | 1,012.9 | 782.1 | 676.1 | 588.6 | 1,041.2 | 1,439.7 | 2,025.2 | 2,145.7 | 3,665.2 |
| 1995 | 3,999.2 | 4,708.0 | 1,962.4 | 1,030.8 | 755.3 | 733.7 | W | 990.8 | W | 1,554.3 | 3,175.1 | 4,663.3 |
| 1996 | 5,387.7 | 5,249.3 | 2,733.1 | 1,268.5 | W | 706.8 | 517.6 | 702.8 | 1,464.4 | 2,129.2 | 2,709.0 | 3,566.8 |
| 1997 | 4,626.9 | 3,254.4 | 1,775.1 | 1,112.9 | 772.2 | 515.3 | 594.6 | 678.1 | 1,393.2 | 1,866.5 | 2,580.3 | 3,546.1 |
| 1998 | 3,294.6 | 2,626.2 | 1,976.0 | 689.1 | 395.1 | 648.3 | 587.2 | 693.0 | 922.3 | 1,252.8 | 1,598.3 | 2,180.1 |
| 1999 | 3,138.4 | 2,469.0 | 1,989.1 | 745.0 | 498.5 | 521.6 | 566.8 | 651.5 | 1,117.5 | 1,478.3 | 1,886.8 | 2,837.9 |
| 2000 | 3,500.1 | 2,757.2 | 1,213.6 | 761.8 | 723.6 | 555.0 | 584.1 | 904.6 | 1,439.5 | 1,273.1 | 1,850.3 | 3,535.7 |
| 2001 | 3,937.7 | 2,535.4 | 2,039.0 | 818.7 | 587.1 | 459.8 | 745.5 | 1,062.7 | 1,172.3 | 1,340.8 | 1,428.0 | 1,910.7 |
| 2002 | 2,861.8 | 2,205.6 | 1,381.1 | 814.4 | 436.6 | 254.2 | W | 673.1 | 839.5 | 1,415.4 | 1,909.8 | 3,051.6 |
| 2003 | 4,025.4 | 3,385.5 | 1,663.8 | W | 443.2 | 297.8 | 519.6 | 583.3 | 1,075.2 | 1,623.2 | 1,476.9 | 2,873.9 |
| 2004 | 4,188.6 | 3,157.4 | 1,258.1 | 700.7 | 304.2 | 312.0 | 238.6 | 431.6 | 648.8 | 1,070.6 | 1,571.1 | 2,422.8 |
| 2005 | 3,200.1 | 2,840.8 | 1,709.1 | 476.4 | 484.5 | 354.3 | 400.3 | 726.0 | 653.4 | 1,120.1 | 1,564.8 | 2,933.8 |
| 2006 | 2,193.7 | 2,173.1 | 1,174.1 | 356.5 | 229.7 | 264.9 | 267.0 | 421.4 | 582.9 | 1,066.4 | 1,193.2 | 1,430.2 |
| 2007 | 1,797.8 | 2,407.7 | W | 458.2 | W | W | W | W | 353.8 | 839.8 | 1,252.8 | 1,476.9 |
| 2008 | 1,675.7 | 1,540.2 | 746.7 | W | 169.9 | W | 133.2 | 214.7 | 260.1 | 810.8 | 1,032.7 | 1,274.5 |
| 2009 | 1,729.2 | 1,445.9 | 661.4 | 243.8 | 187.0 | 209.1 | W | 224.8 | 376.0 | 622.2 | 652.6 | 1,200.7 |
| 2010 | 1,544.6 | 1,291.6 | 490.8 | 132.5 | 109.4 | 66.9 | W | 164.9 | 302.3 | 612.1 | 851.3 | 1,446.8 |
| 2011 | 1,506.2 | 1,044.8 | 450.7 | 200.3 | 71.3 | 41.5 | 87.4 | 134.9 | 320.6 | 427.7 | 669.9 | 623.4 |
| 2012 | 883.4 | 629.0 | 264.4 | 100.6 | 84.0 | 49.8 | 103.4 | 99.5 | 157.6 | 424.5 | 532.7 | 636.4 |
| 2013 | 856.8 | 618.8 | 409.9 | 169.0 | 72.1 | 72.5 | 161.3 | 93.4 | 253.2 | 470.6 | 732.1 | 812.3 |
| 2014 | 1,258.5 | 951.2 | 598.7 | 166.4 | 63.1 | 81.9 | 112.6 | 102.0 | 341.1 | 429.0 | 640.3 | 700.8 |
| 2015 | 1,066.8 | 1,184.3 | 519.6 | 174.8 | 49.1 | 90.1 | 123.3 | 192.6 | 191.4 | 430.7 | 375.7 | 497.0 |
| 2016 | 807.6 | 687.9 | 307.1 | 175.6 | 69.3 | 42.7 | 66.6 | W | 116.9 | 334.5 | 340.7 | 652.7 |
| 2017 | 665.6 | 583.7 | 373.1 | 132.0 | 61.2 | 43.6 | 50.5 | 171.6 | 120.2 | 291.9 | 465.9 | 687.5 |
| 2018 | 1,111.9 | 537.8 | 368.0 | 174.2 | W | 34.5 | 63.9 | W | W | 312.1 | 547.7 | 633.3 |
| 2019 | 807.1 | 605.8 | 387.4 | W | 64.2 | 65.3 | 123.7 | 92.2 | 175.6 | 268.4 | 513.4 | 572.5 |
| 2020 | W | W | W | 212.2 | W | W | 120.7 | 145.3 | 192.4 | 187.1 | 295.3 | 500.1 |
| 2021 | 605.9 | 708.8 | 307.4 | 115.0 | 100.4 | W | 68.2 | 97.2 | 120.4 | 235.8 | 420.9 | 444.6 |
| 2022 | 696.9 | 562.3 | 247.8 | |||||||||
| - = No Data Reported; -- = Not Applicable; NA = Not Available; W = Withheld to avoid disclosure of individual company data. |
| Release Date: 5/19/2022 |
| Next Release Date: TBD |