|
Download Data (XLS File) |
|
||||||||
|
||||||||
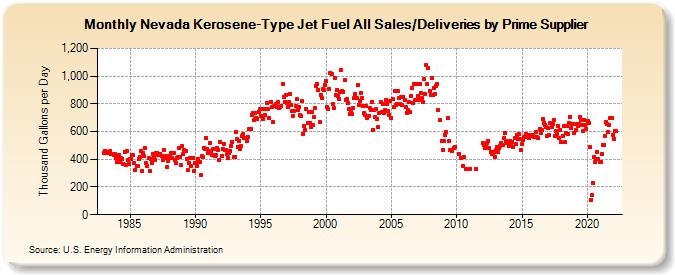
| Nevada Kerosene-Type Jet Fuel All Sales/Deliveries by Prime Supplier (Thousand Gallons per Day) | ||||||||
| Year | Jan | Feb | Mar | Apr | May | Jun | Jul | Aug | Sep | Oct | Nov | Dec |
|---|---|---|---|---|---|---|---|---|---|---|---|---|
| 1983 | 445.9 | 462.4 | 448.4 | 454.4 | 444.0 | 452.9 | 461.9 | 438.2 | 441.3 | 434.1 | 436.2 | 412.4 |
| 1984 | 377.5 | 406.9 | 429.5 | 379.3 | 405.6 | 402.1 | 368.9 | 453.9 | 360.3 | 456.7 | 393.3 | 365.3 |
| 1985 | 400.0 | 402.3 | 431.6 | 428.0 | 371.8 | 325.7 | 348.8 | 350.7 | 405.2 | 413.4 | 459.9 | 318.1 |
| 1986 | 446.7 | 422.1 | 481.4 | 370.7 | 349.7 | 407.2 | 318.6 | 400.2 | 376.2 | 440.9 | 415.5 | 395.0 |
| 1987 | 444.0 | 446.7 | 430.9 | 433.3 | 440.0 | 422.0 | 394.1 | 468.6 | 406.9 | 424.5 | 345.2 | 387.4 |
| 1988 | 408.0 | 420.1 | 446.5 | 412.3 | 441.9 | 394.3 | 370.1 | 410.5 | 415.8 | 478.4 | 414.5 | 357.9 |
| 1989 | 495.5 | 436.8 | 464.5 | 459.7 | 401.9 | 322.6 | 373.4 | 406.9 | 348.6 | 407.1 | 411.2 | 317.7 |
| 1990 | 376.3 | 353.9 | 401.0 | 376.9 | 383.3 | 285.7 | 421.6 | 418.8 | 483.7 | 477.6 | 555.5 | 471.9 |
| 1991 | 443.3 | 516.0 | 459.4 | 430.1 | 471.7 | 471.6 | 424.6 | 430.0 | 482.5 | 463.4 | 393.0 | 524.1 |
| 1992 | 424.1 | 474.8 | 512.6 | 468.6 | 464.6 | 439.9 | 410.1 | 443.1 | 462.9 | 497.6 | 525.8 | 416.3 |
| 1993 | 416.7 | 595.9 | 546.2 | 491.5 | 533.9 | 472.7 | 496.5 | 564.4 | 580.8 | 555.0 | 554.7 | 534.0 |
| 1994 | 562.4 | 615.5 | 620.6 | 620.5 | 718.7 | 732.2 | 683.1 | 734.1 | 699.5 | 694.0 | 743.1 | 762.1 |
| 1995 | 714.7 | 766.1 | 692.5 | 764.0 | 716.0 | 760.7 | 804.9 | 761.9 | 700.1 | 816.1 | 773.9 | 670.4 |
| 1996 | 783.0 | 781.9 | 800.3 | 776.9 | 810.7 | 770.8 | 780.7 | 786.5 | 942.3 | 850.8 | 811.1 | 863.9 |
| 1997 | 805.3 | 779.3 | 811.8 | 870.8 | 791.0 | 745.2 | 715.7 | 749.6 | 787.6 | 836.3 | 754.3 | 775.8 |
| 1998 | 719.0 | 711.1 | 817.3 | 585.6 | 639.1 | 609.4 | 764.9 | 663.1 | 741.4 | 664.0 | 631.8 | 742.3 |
| 1999 | 645.2 | 701.7 | 768.3 | 925.8 | 941.9 | 902.2 | 669.0 | 864.9 | 845.0 | 909.0 | 900.4 | 934.5 |
| 2000 | 961.9 | 777.0 | 763.1 | 909.2 | 1,025.9 | 1,017.1 | 799.7 | 769.5 | 986.7 | 862.9 | 901.8 | 856.4 |
| 2001 | 833.9 | 883.6 | 1,042.7 | 895.1 | 888.7 | 971.1 | 825.9 | 831.8 | 802.8 | 760.1 | 724.3 | 740.0 |
| 2002 | 723.4 | 772.4 | 844.2 | 870.2 | 843.6 | 932.5 | 794.5 | 818.8 | 878.9 | 843.8 | 787.4 | 731.0 |
| 2003 | 719.7 | 781.6 | 694.3 | 713.6 | 769.7 | 752.2 | 815.8 | 613.1 | 756.7 | 701.9 | 762.9 | 690.6 |
| 2004 | 629.3 | 735.9 | 815.9 | 739.3 | 795.3 | 736.0 | 754.5 | 830.7 | 795.9 | 747.7 | 716.2 | 821.4 |
| 2005 | 698.9 | 837.8 | 773.8 | 889.7 | 788.5 | 798.9 | 893.3 | 845.6 | 796.6 | 850.9 | 788.7 | 851.4 |
| 2006 | 826.8 | 780.7 | 736.2 | 754.6 | 810.3 | 742.8 | 855.4 | 913.7 | 808.0 | 944.5 | 830.7 | 944.2 |
| 2007 | 855.6 | 827.7 | 946.4 | 879.0 | 841.7 | 812.0 | 979.9 | 873.7 | 1,080.0 | 944.6 | 1,055.5 | 894.3 |
| 2008 | 862.0 | 986.1 | 864.4 | 915.0 | 871.6 | 928.7 | 943.7 | 751.9 | W | 683.1 | 531.0 | 469.6 |
| 2009 | 535.1 | 576.0 | 596.2 | W | 696.9 | 530.1 | 467.4 | 464.3 | 461.6 | 480.5 | 489.2 | W |
| 2010 | W | W | 441.1 | W | 405.7 | W | 350.2 | 414.9 | 332.2 | W | W | W |
| 2011 | 333.3 | W | W | W | W | W | 332.7 | W | W | W | W | W |
| 2012 | 515.1 | 506.0 | 482.0 | 490.5 | 517.5 | 530.5 | 483.3 | 455.2 | 435.9 | 440.2 | 454.9 | 417.9 |
| 2013 | 465.8 | 488.9 | 450.0 | 480.6 | 497.0 | 519.4 | 505.8 | 551.9 | 589.4 | 531.5 | 518.0 | 520.8 |
| 2014 | 496.7 | 531.0 | 509.0 | 528.1 | 488.3 | 553.3 | 508.1 | 578.7 | 543.5 | 581.6 | 547.7 | 468.9 |
| 2015 | 509.9 | 540.6 | 561.6 | 561.5 | 584.2 | 577.7 | 555.9 | 574.7 | 567.7 | 564.4 | 577.3 | 559.3 |
| 2016 | 559.8 | 599.7 | 560.2 | 551.2 | 620.0 | 591.8 | 608.9 | 692.0 | 663.4 | 648.0 | 631.4 | 565.1 |
| 2017 | 622.6 | 574.4 | 658.9 | 634.4 | 652.5 | 682.5 | 571.1 | 602.6 | 584.6 | 636.5 | 552.3 | 611.1 |
| 2018 | 523.9 | 570.7 | 637.3 | 523.6 | 590.3 | 637.1 | 585.2 | 658.1 | 707.5 | 627.6 | 653.8 | 656.7 |
| 2019 | 592.3 | 607.9 | 651.1 | 642.5 | 652.9 | 703.0 | 686.6 | 649.0 | 605.4 | 684.1 | 647.9 | 618.8 |
| 2020 | 677.6 | 663.6 | 490.1 | 109.1 | 139.6 | 227.9 | 415.0 | 378.8 | 402.9 | 454.4 | 399.7 | 381.9 |
| 2021 | 383.5 | 437.5 | 505.4 | 505.8 | 567.3 | 670.2 | 656.9 | 597.6 | 649.5 | 698.9 | 700.1 | 578.3 |
| 2022 | 546.1 | 601.4 | 601.0 | |||||||||
| - = No Data Reported; -- = Not Applicable; NA = Not Available; W = Withheld to avoid disclosure of individual company data. |
| Release Date: 5/19/2022 |
| Next Release Date: TBD |