|
Download Data (XLS File) |
|
||||||||
|
||||||||
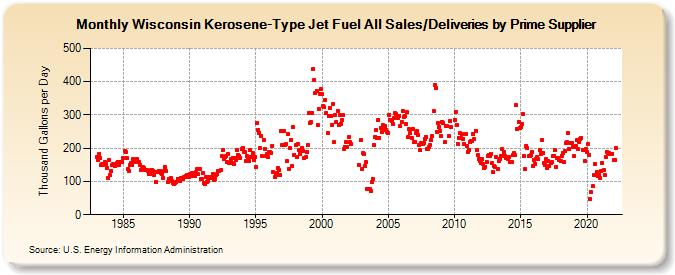
| Wisconsin Kerosene-Type Jet Fuel All Sales/Deliveries by Prime Supplier (Thousand Gallons per Day) | ||||||||
| Year | Jan | Feb | Mar | Apr | May | Jun | Jul | Aug | Sep | Oct | Nov | Dec |
|---|---|---|---|---|---|---|---|---|---|---|---|---|
| 1983 | 172.4 | 165.0 | 183.8 | 171.6 | 150.1 | 153.8 | 150.7 | 157.3 | 152.5 | 140.6 | 110.2 | 165.5 |
| 1984 | 118.0 | 130.1 | 148.5 | 153.0 | 147.9 | 149.7 | 155.0 | 158.9 | 149.1 | 158.3 | 157.6 | 158.7 |
| 1985 | 170.1 | 190.8 | 188.2 | 171.5 | 138.1 | 132.1 | 150.6 | 154.8 | 149.6 | 167.2 | 159.7 | 164.3 |
| 1986 | 167.8 | 159.1 | 157.4 | 149.5 | 135.1 | 138.1 | 142.5 | 139.4 | 135.7 | 134.0 | 130.2 | 122.9 |
| 1987 | 121.7 | 133.0 | 135.1 | 130.9 | 120.3 | 128.5 | 98.9 | 128.6 | 130.5 | 131.0 | 125.8 | 122.2 |
| 1988 | 110.6 | 132.5 | 142.7 | 130.7 | 97.9 | 107.2 | 105.3 | 110.4 | 100.8 | 96.1 | 93.8 | 95.3 |
| 1989 | 98.3 | 108.6 | 103.8 | 102.3 | 110.9 | 110.1 | 108.6 | 114.5 | 112.7 | 117.1 | 120.1 | 114.2 |
| 1990 | 121.7 | 121.0 | 124.4 | 117.5 | 126.4 | 115.3 | 127.6 | 137.4 | 121.0 | 138.9 | 107.1 | 106.8 |
| 1991 | 124.5 | 94.1 | 91.0 | 112.2 | 99.6 | 101.6 | 112.9 | 109.4 | 112.8 | 123.4 | 105.3 | 107.1 |
| 1992 | 120.6 | 121.5 | 132.0 | 132.7 | 133.6 | 175.1 | 193.6 | 167.2 | 173.9 | 176.8 | 157.0 | 183.3 |
| 1993 | 156.7 | 166.4 | 155.1 | 170.6 | 151.4 | 170.4 | 165.2 | 195.2 | 180.2 | 176.9 | 171.3 | 197.1 |
| 1994 | 200.7 | 189.5 | 187.3 | 161.6 | 176.4 | 172.0 | 162.1 | 194.7 | 174.8 | 184.1 | 163.7 | 174.4 |
| 1995 | 142.9 | 277.1 | 255.2 | 247.1 | 199.8 | 236.1 | 175.9 | 226.0 | 198.6 | 177.9 | 182.0 | 173.0 |
| 1996 | 189.0 | 187.8 | 186.5 | 207.7 | 127.5 | 113.5 | 119.8 | 125.0 | 140.1 | 135.7 | 119.0 | 252.3 |
| 1997 | 210.4 | 251.4 | 210.4 | 212.3 | 160.7 | 242.2 | 137.7 | 200.9 | 225.6 | 145.6 | 262.3 | 180.5 |
| 1998 | 208.5 | 172.0 | 213.2 | 193.5 | 182.8 | 196.0 | 201.0 | 192.9 | 170.0 | 172.2 | 189.4 | 208.5 |
| 1999 | 306.2 | 276.0 | 277.6 | 306.1 | 438.5 | 406.1 | 365.1 | 372.8 | 268.5 | 319.2 | 363.7 | 376.7 |
| 2000 | 361.5 | 327.0 | 323.5 | 345.3 | 305.2 | 245.3 | 297.6 | 321.8 | 296.2 | 270.2 | 331.8 | 217.6 |
| 2001 | 298.4 | 279.3 | 311.8 | 269.6 | 298.5 | 273.5 | 285.4 | 299.2 | 198.4 | 203.5 | 217.5 | 203.0 |
| 2002 | 233.9 | 217.3 | 214.0 | W | W | W | W | W | W | 149.3 | W | 223.2 |
| 2003 | 138.4 | 184.7 | 181.1 | 146.7 | 158.3 | 78.8 | 78.5 | 77.5 | 72.3 | 98.3 | 107.9 | 210.0 |
| 2004 | 233.7 | 255.2 | 230.8 | 286.0 | 231.5 | 261.8 | 250.1 | 268.2 | 260.0 | 265.4 | 255.0 | 247.6 |
| 2005 | 246.5 | 300.9 | 286.2 | 283.0 | 273.4 | 290.1 | 305.5 | 304.2 | 296.0 | 291.4 | 298.1 | 265.3 |
| 2006 | 279.3 | 312.9 | 293.6 | 295.6 | 272.6 | 307.6 | 233.0 | 256.3 | 246.4 | 231.6 | 259.0 | 218.4 |
| 2007 | 219.2 | 246.4 | 251.6 | 239.4 | 208.9 | 193.2 | 215.3 | 212.7 | 216.5 | 227.8 | 234.9 | 196.1 |
| 2008 | 196.8 | 203.9 | 210.2 | 224.7 | 235.2 | 310.5 | 391.4 | 381.5 | 248.8 | 275.9 | 264.6 | 251.5 |
| 2009 | 237.8 | 279.0 | 276.5 | 218.0 | 266.2 | 266.1 | W | 236.0 | 280.5 | 262.7 | W | W |
| 2010 | 285.1 | 307.4 | 270.6 | 212.7 | 231.2 | 244.6 | 231.2 | 242.0 | 228.6 | 212.6 | 242.8 | 207.3 |
| 2011 | 189.8 | 195.2 | 218.3 | 221.3 | 220.3 | 241.8 | 227.1 | 252.7 | 194.6 | 178.7 | 166.7 | 160.7 |
| 2012 | 154.4 | 166.9 | 151.1 | 139.8 | 144.3 | 159.4 | 176.3 | 179.3 | 175.1 | 182.5 | 154.6 | 128.3 |
| 2013 | 145.1 | 142.6 | 172.7 | 138.4 | 162.8 | 168.0 | 178.0 | 196.5 | 178.0 | 189.9 | 176.4 | 170.4 |
| 2014 | 166.9 | 174.4 | 159.3 | 157.8 | 159.3 | 179.8 | 184.6 | 178.3 | 328.7 | 256.7 | 278.9 | 260.8 |
| 2015 | 262.3 | 274.0 | 301.6 | 175.9 | 138.1 | 207.7 | 199.9 | 175.9 | 177.8 | 180.4 | 189.3 | 145.7 |
| 2016 | 165.4 | 152.9 | 167.7 | 174.2 | 166.9 | 194.7 | 182.3 | 225.2 | 186.1 | 155.5 | 150.4 | 167.1 |
| 2017 | 141.6 | 161.3 | 146.5 | 156.1 | 157.5 | 175.9 | 177.5 | 193.1 | 143.9 | 170.3 | 169.8 | 165.2 |
| 2018 | 160.5 | 177.9 | 186.2 | 158.6 | 190.6 | 216.2 | 217.3 | 246.9 | 197.3 | 216.3 | 214.4 | 204.5 |
| 2019 | 175.1 | 202.3 | 207.4 | 224.7 | 197.2 | 219.1 | 226.8 | 231.5 | 195.0 | 194.2 | 162.7 | 196.4 |
| 2020 | 187.6 | 213.0 | 179.2 | 45.8 | 67.9 | 85.9 | 119.2 | 152.0 | 118.8 | 128.3 | 115.9 | 120.8 |
| 2021 | 110.0 | 130.9 | 156.0 | 133.5 | 120.0 | 173.3 | 187.8 | 186.4 | 186.2 | 183.2 | 182.4 | 183.5 |
| 2022 | 164.5 | 164.5 | 200.2 | |||||||||
| - = No Data Reported; -- = Not Applicable; NA = Not Available; W = Withheld to avoid disclosure of individual company data. |
| Release Date: 5/19/2022 |
| Next Release Date: TBD |