|
Download Data (XLS File) |
|
||||||||
|
||||||||
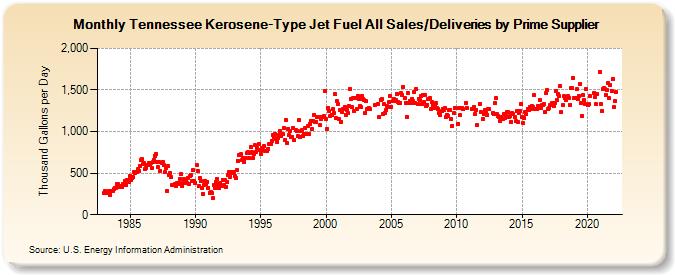
| Tennessee Kerosene-Type Jet Fuel All Sales/Deliveries by Prime Supplier (Thousand Gallons per Day) | ||||||||
| Year | Jan | Feb | Mar | Apr | May | Jun | Jul | Aug | Sep | Oct | Nov | Dec |
|---|---|---|---|---|---|---|---|---|---|---|---|---|
| 1983 | 256.9 | 282.0 | 256.6 | 264.3 | 258.2 | 282.6 | 242.1 | 287.7 | 281.8 | 305.9 | 321.4 | 321.9 |
| 1984 | 368.2 | 368.9 | 327.8 | 338.6 | 340.6 | 337.4 | 368.5 | 401.7 | 359.0 | 412.9 | 413.7 | 395.2 |
| 1985 | 462.9 | 416.8 | 437.8 | 450.0 | 513.7 | 506.3 | 518.4 | 544.4 | 529.2 | 586.3 | 663.6 | 666.6 |
| 1986 | 604.2 | 617.6 | 549.5 | 564.5 | 598.2 | 621.0 | 594.3 | 619.9 | 558.9 | 633.3 | 661.5 | 711.9 |
| 1987 | 730.2 | 629.0 | 571.2 | 628.6 | 531.3 | 623.7 | 637.2 | 596.7 | 508.8 | 567.6 | 288.1 | 583.0 |
| 1988 | 476.0 | 498.0 | 449.0 | 361.5 | 352.4 | 367.5 | 342.1 | 380.7 | 371.8 | 386.0 | 432.2 | 487.2 |
| 1989 | 342.7 | 386.5 | 424.9 | 412.7 | 377.9 | 444.6 | 364.4 | 469.1 | 477.3 | 399.7 | 532.2 | 407.6 |
| 1990 | 386.6 | 599.8 | 529.3 | 344.0 | 439.5 | 408.0 | 323.5 | 253.3 | 351.8 | 409.6 | 368.8 | 398.7 |
| 1991 | 321.5 | 265.9 | 270.9 | 261.1 | 199.2 | 358.4 | 326.7 | 390.6 | 431.3 | 358.6 | 326.2 | 384.9 |
| 1992 | 341.0 | 423.1 | 359.6 | 416.7 | 337.3 | 395.3 | 477.0 | 516.4 | 458.9 | 512.0 | 499.2 | 514.9 |
| 1993 | 463.1 | 440.9 | 534.5 | 651.6 | 716.5 | 722.9 | 726.1 | 654.9 | 679.2 | 637.2 | 687.1 | 740.5 |
| 1994 | 749.8 | 682.9 | 739.4 | 813.4 | 749.1 | 685.2 | 732.2 | 834.0 | 758.7 | 803.8 | 850.0 | 772.8 |
| 1995 | 728.2 | 804.3 | 775.8 | 822.6 | 769.8 | 770.8 | 763.3 | 796.0 | 852.9 | 852.5 | 887.8 | 963.7 |
| 1996 | 933.1 | 968.8 | 914.7 | 878.3 | 922.6 | 964.4 | 1,008.5 | 942.9 | 967.1 | 1,043.5 | 896.6 | 1,139.5 |
| 1997 | 859.0 | 1,034.8 | 956.7 | 1,008.4 | 933.1 | 935.9 | 1,044.3 | 897.9 | 1,014.2 | 1,003.0 | 944.7 | 1,133.2 |
| 1998 | 936.5 | 1,006.9 | 1,014.5 | 945.2 | 975.7 | 1,038.5 | 968.6 | 1,061.0 | 973.0 | 1,094.5 | 1,132.9 | 1,025.4 |
| 1999 | 1,131.6 | 1,204.2 | 1,118.1 | 1,120.6 | 1,174.0 | 1,176.4 | 1,072.8 | 1,145.7 | 1,178.4 | 1,174.2 | 1,183.7 | 1,482.8 |
| 2000 | 1,150.0 | 1,033.8 | 1,289.0 | 1,244.9 | 1,187.3 | 1,202.0 | 1,269.6 | 1,225.3 | 1,451.2 | 1,163.7 | 1,363.6 | 1,330.1 |
| 2001 | 1,145.4 | 1,260.5 | 1,120.7 | 1,238.0 | 1,271.3 | 1,296.8 | 1,201.4 | 1,256.3 | 1,227.2 | 1,303.7 | 1,514.1 | 1,394.2 |
| 2002 | 1,289.5 | 1,398.8 | 1,251.1 | 1,409.0 | 1,267.0 | 1,433.2 | 1,386.1 | 1,302.3 | 1,291.1 | 1,431.6 | 1,392.1 | 1,376.9 |
| 2003 | 1,226.4 | 1,363.8 | 1,276.0 | 1,288.2 | 1,268.1 | NA | NA | NA | NA | 1,318.7 | NA | NA |
| 2004 | 1,330.5 | 1,176.9 | 1,382.5 | 1,389.1 | 1,209.9 | 1,325.3 | 1,228.9 | 1,259.1 | 1,308.2 | 1,300.0 | 1,358.7 | 1,425.2 |
| 2005 | 1,300.5 | 1,361.5 | 1,393.3 | 1,370.6 | 1,374.9 | 1,455.0 | 1,356.0 | 1,341.5 | 1,343.5 | 1,462.2 | 1,437.8 | 1,540.6 |
| 2006 | 1,399.4 | 1,347.4 | 1,178.7 | 1,467.2 | 1,344.2 | 1,371.7 | 1,341.7 | 1,395.8 | 1,361.8 | 1,475.9 | 1,344.4 | 1,514.2 |
| 2007 | 1,327.1 | 1,394.6 | 1,376.2 | 1,424.6 | 1,327.4 | 1,438.1 | 1,355.3 | 1,438.1 | 1,302.2 | 1,323.3 | 1,387.4 | 1,400.3 |
| 2008 | 1,268.0 | 1,350.4 | 1,319.0 | 1,280.8 | 1,315.9 | 1,338.4 | 1,281.5 | 1,273.5 | 1,223.6 | 1,202.6 | 1,244.6 | 1,273.5 |
| 2009 | 1,255.8 | 1,280.4 | 1,175.5 | 1,204.7 | 1,185.2 | 1,256.3 | 1,258.7 | 1,153.6 | 1,072.4 | 1,218.0 | 1,285.3 | W |
| 2010 | W | 1,096.5 | 1,288.0 | 1,193.4 | W | 1,283.5 | 1,270.6 | W | 1,343.4 | 1,287.3 | W | W |
| 2011 | W | W | 1,265.3 | W | 1,296.8 | 1,208.2 | 1,261.0 | 1,077.2 | W | 1,334.9 | 1,232.7 | W |
| 2012 | 1,155.7 | 1,208.6 | 1,256.5 | 1,226.2 | 1,202.5 | 1,270.5 | 1,270.8 | W | W | 1,223.2 | 1,212.2 | 1,339.6 |
| 2013 | 1,405.5 | 1,207.9 | 1,190.3 | 1,171.1 | 1,126.9 | 1,172.1 | 1,154.8 | 1,210.1 | 1,157.7 | 1,184.8 | 1,232.0 | 1,238.6 |
| 2014 | 1,171.1 | 1,185.9 | 1,118.3 | 1,222.9 | 1,206.5 | 1,177.1 | 1,125.7 | 1,243.9 | 1,119.9 | 1,221.0 | 1,246.7 | 1,336.8 |
| 2015 | 1,177.3 | 1,097.1 | 1,160.7 | 1,237.8 | 1,207.2 | 1,274.0 | 1,260.2 | 1,293.9 | 1,275.3 | 1,309.9 | 1,292.8 | 1,437.3 |
| 2016 | 1,265.8 | 1,270.4 | 1,265.9 | 1,309.3 | 1,378.4 | 1,279.3 | 1,318.1 | 1,320.2 | 1,333.7 | 1,238.3 | 1,459.6 | 1,496.5 |
| 2017 | 1,266.8 | 1,285.8 | 1,314.0 | 1,341.0 | 1,313.4 | 1,307.3 | 1,346.6 | 1,488.7 | 1,373.8 | 1,455.7 | 1,427.6 | 1,545.2 |
| 2018 | 1,233.5 | 1,314.7 | 1,423.4 | 1,407.0 | 1,382.6 | 1,402.4 | 1,424.3 | 1,407.9 | 1,324.5 | 1,528.6 | 1,518.7 | 1,642.3 |
| 2019 | 1,400.7 | 1,405.8 | 1,508.5 | 1,388.8 | 1,427.5 | 1,576.1 | 1,339.5 | 1,187.5 | 1,442.2 | 1,376.2 | 1,330.5 | 1,509.8 |
| 2020 | 1,318.0 | 1,332.6 | 1,426.1 | W | W | W | 1,460.6 | 1,413.8 | 1,325.8 | 1,448.5 | W | 1,719.5 |
| 2021 | 1,328.3 | 1,249.8 | 1,506.5 | 1,523.6 | 1,505.8 | 1,438.8 | 1,495.2 | 1,580.1 | 1,398.5 | 1,556.0 | 1,489.8 | 1,630.9 |
| 2022 | 1,290.7 | 1,368.7 | 1,471.1 | |||||||||
| - = No Data Reported; -- = Not Applicable; NA = Not Available; W = Withheld to avoid disclosure of individual company data. |
| Release Date: 5/19/2022 |
| Next Release Date: TBD |