|
Download Data (XLS File) |
|
||||||||
|
||||||||
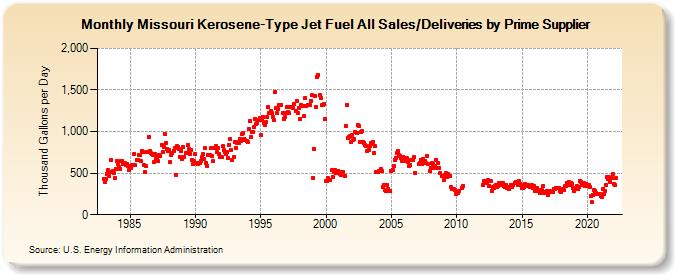
| Missouri Kerosene-Type Jet Fuel All Sales/Deliveries by Prime Supplier (Thousand Gallons per Day) | ||||||||
| Year | Jan | Feb | Mar | Apr | May | Jun | Jul | Aug | Sep | Oct | Nov | Dec |
|---|---|---|---|---|---|---|---|---|---|---|---|---|
| 1983 | 429.8 | 394.4 | 432.5 | 487.3 | 535.8 | 463.6 | 512.7 | 656.5 | 523.4 | 502.3 | 435.7 | 553.8 |
| 1984 | 647.1 | 609.7 | 571.0 | 552.0 | 651.3 | 643.1 | 609.5 | 616.2 | 598.4 | 612.9 | 590.1 | 537.1 |
| 1985 | 591.4 | 560.5 | 599.1 | 602.9 | 732.9 | 592.8 | 657.5 | 652.5 | 718.5 | 720.2 | 642.5 | 766.6 |
| 1986 | 754.2 | 598.7 | 513.3 | 582.4 | 755.1 | 932.4 | 760.6 | 737.1 | 735.6 | 720.3 | 628.2 | 727.9 |
| 1987 | 675.7 | 699.2 | 639.9 | 722.3 | 704.4 | 840.6 | 755.3 | 808.7 | 966.8 | 864.4 | 794.8 | 768.5 |
| 1988 | 779.1 | 631.4 | 723.6 | 738.4 | 767.8 | 799.9 | 482.8 | 826.2 | 810.7 | 787.3 | 694.4 | 762.8 |
| 1989 | 673.0 | 811.2 | 693.0 | 738.1 | 746.5 | 839.2 | 786.8 | 727.5 | 777.3 | 662.8 | 613.1 | 642.6 |
| 1990 | 732.5 | 626.0 | 607.0 | 622.4 | 622.3 | 644.3 | 688.7 | 725.0 | 667.2 | 797.1 | 626.1 | 589.4 |
| 1991 | 720.4 | 714.3 | 797.9 | 701.6 | 642.3 | 798.4 | 800.7 | 821.1 | 749.7 | 800.3 | 732.5 | 697.3 |
| 1992 | 688.8 | 820.7 | 772.7 | 755.8 | 733.5 | 754.8 | 686.2 | 841.1 | 905.1 | 778.8 | 656.7 | 693.5 |
| 1993 | 879.4 | 807.9 | 865.9 | 876.1 | 868.3 | 914.4 | 891.9 | 968.2 | 981.3 | 908.7 | 894.6 | 887.6 |
| 1994 | 874.3 | 1,025.0 | 1,124.5 | 938.3 | 993.0 | 1,000.5 | 1,052.5 | 1,150.1 | 1,089.6 | 1,105.4 | 1,138.3 | 1,159.6 |
| 1995 | 956.8 | 1,133.5 | 1,174.5 | 1,103.4 | 1,075.2 | 1,111.1 | 1,178.0 | 1,295.5 | 1,222.9 | 1,249.9 | 1,220.6 | 1,179.6 |
| 1996 | 1,135.2 | 1,475.8 | 1,279.1 | 1,221.8 | 1,269.8 | 1,320.2 | 1,325.0 | 1,322.6 | 1,220.2 | 1,156.9 | 1,175.9 | 1,220.3 |
| 1997 | 1,291.5 | 1,234.6 | 1,217.7 | 1,294.5 | 1,297.5 | 1,290.6 | 1,282.7 | 1,330.7 | 1,247.6 | 1,365.8 | 1,223.5 | 1,286.9 |
| 1998 | 1,156.5 | 1,324.2 | 1,302.5 | 1,301.4 | 1,183.2 | 1,407.8 | 1,308.1 | 1,321.3 | 1,316.4 | 1,322.5 | 1,368.7 | 1,436.0 |
| 1999 | 446.0 | 790.6 | 1,428.2 | 1,300.3 | 1,661.9 | 1,678.3 | 1,437.5 | 1,403.5 | 1,318.3 | 1,322.1 | 1,328.5 | 1,148.5 |
| 2000 | 408.0 | 411.1 | 439.5 | 418.8 | 421.3 | 534.2 | 455.9 | 512.3 | 532.5 | 501.8 | 527.5 | 527.7 |
| 2001 | 515.6 | 491.0 | 482.7 | 510.7 | 511.6 | 464.5 | 1,071.1 | 1,318.7 | 925.3 | 939.9 | 946.2 | 871.9 |
| 2002 | 962.6 | 894.4 | 907.4 | 996.0 | 977.7 | 1,081.7 | 1,071.5 | 877.0 | 993.9 | 1,001.0 | 875.0 | 864.2 |
| 2003 | 834.2 | 824.0 | 767.9 | 781.3 | 830.4 | 860.2 | 853.7 | 879.0 | 746.5 | 823.0 | 509.1 | 510.6 |
| 2004 | 509.3 | 522.0 | 543.8 | 530.9 | 333.7 | 359.7 | 296.0 | 280.5 | 361.5 | 309.4 | 286.0 | 284.5 |
| 2005 | 526.9 | 542.0 | 583.5 | 655.1 | 678.6 | 739.4 | 765.2 | 718.2 | 705.4 | 677.7 | 648.4 | 690.1 |
| 2006 | 642.2 | 678.1 | 678.1 | 639.4 | 588.6 | 601.5 | 661.8 | 662.8 | 661.6 | 691.0 | 504.4 | W |
| 2007 | W | 604.4 | 618.5 | 661.5 | 613.1 | 671.9 | W | 640.0 | 621.1 | 704.6 | 610.6 | 521.2 |
| 2008 | 564.2 | 617.6 | 612.9 | 564.0 | 580.3 | 662.5 | 565.0 | 621.5 | 563.4 | 504.2 | 463.6 | 459.6 |
| 2009 | 415.5 | 476.6 | 499.4 | 450.1 | 494.3 | 461.5 | 468.4 | 328.8 | 314.3 | 304.6 | 298.5 | 250.0 |
| 2010 | 258.6 | 261.1 | 287.7 | W | W | 322.1 | 349.8 | W | W | W | W | W |
| 2011 | W | W | W | W | W | W | W | W | W | W | W | W |
| 2012 | 351.7 | 406.1 | 403.3 | 399.2 | 382.2 | 415.7 | 348.0 | 402.2 | 284.6 | 333.3 | 317.4 | 350.5 |
| 2013 | 360.8 | 336.4 | 344.8 | 375.6 | 354.3 | 379.7 | 386.4 | 344.4 | 333.1 | 360.9 | 323.6 | 331.3 |
| 2014 | 312.1 | 338.8 | 362.7 | 331.5 | 356.1 | 383.3 | 395.3 | 388.4 | 362.8 | 401.1 | 371.5 | 363.0 |
| 2015 | 319.4 | 317.6 | 328.8 | 369.3 | 342.3 | 360.1 | 344.3 | 330.4 | 335.1 | 356.0 | 319.0 | 349.2 |
| 2016 | 288.3 | 312.2 | 315.9 | 279.9 | 263.9 | 295.1 | 293.3 | 342.9 | 258.9 | 271.0 | 255.4 | 285.5 |
| 2017 | 243.0 | 275.8 | 281.9 | 278.5 | 275.2 | 315.1 | 310.3 | 318.8 | 316.2 | 324.6 | 319.1 | 283.7 |
| 2018 | 278.5 | 311.7 | 293.9 | 341.0 | 347.3 | 382.7 | 382.2 | 389.4 | 361.9 | 385.6 | 373.8 | 326.3 |
| 2019 | 283.0 | 313.4 | 350.5 | 305.5 | 327.5 | 408.7 | 399.3 | 373.5 | 351.7 | 380.0 | 344.4 | 366.4 |
| 2020 | 339.7 | 360.2 | 332.4 | 223.0 | 147.2 | 242.3 | 298.9 | 284.6 | 256.9 | 243.9 | 244.6 | 253.1 |
| 2021 | 229.9 | 218.9 | 311.4 | 249.7 | 279.8 | 361.3 | 449.1 | 430.5 | 448.8 | 392.0 | 440.3 | 483.9 |
| 2022 | 374.2 | 359.3 | 438.9 | |||||||||
| - = No Data Reported; -- = Not Applicable; NA = Not Available; W = Withheld to avoid disclosure of individual company data. |
| Release Date: 5/19/2022 |
| Next Release Date: TBD |