|
Download Data (XLS File) |
|
||||||||
|
||||||||
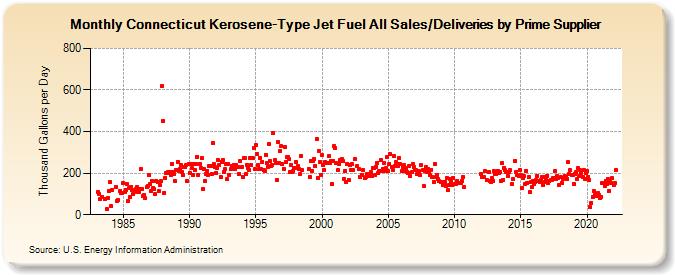
| Connecticut Kerosene-Type Jet Fuel All Sales/Deliveries by Prime Supplier (Thousand Gallons per Day) | ||||||||
| Year | Jan | Feb | Mar | Apr | May | Jun | Jul | Aug | Sep | Oct | Nov | Dec |
|---|---|---|---|---|---|---|---|---|---|---|---|---|
| 1983 | W | 111.3 | 99.2 | 74.2 | W | 86.6 | W | 73.6 | W | 27.3 | 81.6 | 116.3 |
| 1984 | 156.8 | 39.8 | 118.2 | W | W | 133.2 | 66.4 | 71.0 | W | 112.7 | 106.2 | 104.3 |
| 1985 | 153.3 | 107.6 | 119.0 | 149.1 | 66.2 | 127.1 | 83.8 | 135.5 | 117.6 | 98.4 | 109.8 | 126.0 |
| 1986 | 132.1 | 108.6 | 108.9 | 123.7 | 218.9 | 122.3 | 89.3 | 94.6 | 78.4 | 131.3 | 139.6 | 191.0 |
| 1987 | 149.1 | 114.6 | 164.4 | 129.7 | 122.4 | 99.6 | 164.4 | 156.7 | 114.6 | 141.2 | 160.4 | 619.3 |
| 1988 | 452.9 | 106.4 | 178.1 | 202.9 | 203.5 | 200.3 | 206.6 | 193.2 | 242.9 | 205.1 | 198.1 | 162.1 |
| 1989 | 216.6 | 254.4 | 211.5 | 220.0 | 241.4 | 204.8 | 189.8 | 230.7 | 231.7 | 239.3 | 163.3 | 244.4 |
| 1990 | 202.1 | 242.1 | 222.8 | 188.9 | 243.6 | 215.0 | 243.0 | 280.0 | 193.2 | 244.8 | 225.8 | 271.8 |
| 1991 | 123.3 | 217.7 | 164.0 | 197.7 | 212.1 | 192.6 | 233.0 | 233.8 | 197.4 | 346.0 | 242.2 | 227.1 |
| 1992 | 202.5 | 222.5 | 261.3 | 241.0 | 181.2 | 255.0 | 264.2 | 207.5 | 218.0 | 244.4 | 169.8 | 245.4 |
| 1993 | 193.4 | 217.6 | 233.2 | 227.2 | 240.5 | 221.3 | 239.3 | 230.0 | 231.6 | 197.9 | 256.4 | 228.9 |
| 1994 | 182.7 | 272.0 | 272.5 | 194.3 | 241.1 | 226.0 | 217.2 | 272.1 | 238.5 | 272.9 | 321.7 | 217.5 |
| 1995 | 333.5 | 293.0 | 237.7 | 220.1 | 273.5 | 218.0 | 255.2 | 214.1 | 210.9 | 289.3 | 250.8 | 230.5 |
| 1996 | 339.3 | 256.9 | 236.5 | 240.3 | 393.4 | 262.8 | 249.8 | 169.1 | 350.7 | 249.0 | 308.8 | 328.8 |
| 1997 | 244.9 | 221.8 | 327.8 | 253.9 | 276.0 | 278.2 | 266.8 | 207.6 | 238.8 | 206.9 | 208.2 | 224.2 |
| 1998 | 254.3 | 222.3 | 234.3 | 220.1 | 194.7 | 284.0 | 212.9 | NA | NA | NA | NA | NA |
| 1999 | 220.0 | 182.1 | 260.6 | 208.4 | 260.0 | 269.2 | 235.6 | 366.5 | 178.4 | 308.2 | 254.1 | 192.2 |
| 2000 | 287.6 | 237.3 | 214.0 | 253.6 | 246.4 | 246.7 | 280.4 | 251.1 | 259.8 | 148.8 | 259.6 | 329.8 |
| 2001 | 318.5 | 247.1 | 213.1 | 242.1 | 261.4 | 256.1 | 268.5 | 256.2 | 173.9 | 211.7 | 157.7 | 245.7 |
| 2002 | 168.5 | 238.4 | 214.6 | 242.9 | 217.4 | W | 266.7 | W | 236.1 | 221.4 | 182.3 | W |
| 2003 | 192.5 | 212.9 | W | 178.0 | 183.1 | 196.2 | 186.8 | 185.8 | 205.2 | 185.4 | 224.0 | 223.2 |
| 2004 | 193.3 | 231.9 | 251.1 | 200.0 | 211.2 | 265.0 | 208.5 | 218.9 | 250.2 | 212.5 | 224.9 | 278.3 |
| 2005 | 209.2 | 245.5 | 291.7 | 227.7 | 216.2 | 281.3 | 236.3 | 255.1 | 246.0 | 236.4 | 272.6 | 243.8 |
| 2006 | 208.2 | 230.0 | 238.5 | 212.2 | 222.5 | 206.9 | 200.7 | 235.6 | 186.0 | 203.2 | 245.7 | 230.0 |
| 2007 | 215.9 | 213.5 | 194.3 | 199.9 | 208.9 | 190.1 | 237.5 | 213.3 | 138.2 | 209.0 | 228.0 | 205.0 |
| 2008 | 221.2 | 205.1 | 190.8 | 216.5 | 181.1 | 156.9 | 243.8 | 181.5 | 193.3 | 170.6 | 160.0 | W |
| 2009 | 157.5 | 155.3 | 145.0 | 158.9 | 139.2 | 177.5 | 118.7 | 141.2 | 171.1 | 158.6 | 144.6 | 175.8 |
| 2010 | 147.5 | 147.2 | 161.9 | 150.5 | W | W | 152.7 | 163.1 | 181.5 | 131.2 | W | W |
| 2011 | W | W | W | W | W | W | W | W | W | W | W | W |
| 2012 | 196.2 | 181.8 | W | 181.3 | 208.5 | 164.7 | W | 207.6 | 164.5 | 159.7 | 176.3 | 161.6 |
| 2013 | 208.2 | 194.3 | 195.3 | 212.1 | 202.7 | 207.0 | 164.4 | 246.4 | 169.3 | 225.9 | 213.9 | 207.4 |
| 2014 | 188.4 | 205.8 | 213.1 | NA | 145.8 | 171.3 | NA | 259.7 | 204.6 | 188.9 | 187.3 | 214.2 |
| 2015 | 190.2 | 126.8 | 175.2 | 185.6 | 146.4 | 212.4 | 153.8 | 180.3 | 109.0 | 155.4 | 133.6 | 160.6 |
| 2016 | 149.6 | 156.9 | 165.9 | 187.9 | 164.2 | 159.3 | 165.9 | 180.3 | 143.4 | 158.0 | 182.8 | 169.2 |
| 2017 | 188.2 | 150.5 | 161.1 | 164.6 | 165.1 | 175.3 | 177.2 | 208.5 | 171.9 | 184.6 | 177.5 | 144.3 |
| 2018 | 179.3 | 153.9 | 173.0 | 175.3 | 186.6 | 182.6 | 173.9 | 252.6 | 196.0 | 213.2 | 188.9 | 192.7 |
| 2019 | 149.7 | 196.6 | 205.4 | 172.3 | 222.5 | 184.0 | 213.0 | 201.2 | 183.3 | 215.7 | 174.0 | 198.7 |
| 2020 | 208.1 | 183.2 | 166.6 | 36.8 | 55.7 | 87.3 | 113.4 | 95.6 | 92.4 | 100.0 | 104.1 | 92.6 |
| 2021 | 82.7 | 87.2 | 154.4 | 151.0 | 136.5 | 162.5 | 149.2 | 169.4 | 113.7 | 163.9 | 153.3 | 175.2 |
| 2022 | 140.8 | 152.3 | 214.8 | |||||||||
| - = No Data Reported; -- = Not Applicable; NA = Not Available; W = Withheld to avoid disclosure of individual company data. |
| Release Date: 5/19/2022 |
| Next Release Date: TBD |