|
Download Data (XLS File) |
|
||||||||
|
||||||||
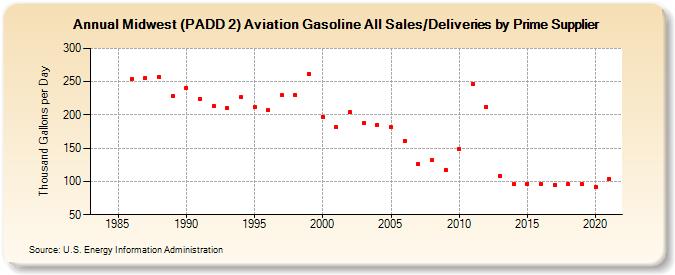
| Midwest (PADD 2) Aviation Gasoline All Sales/Deliveries by Prime Supplier (Thousand Gallons per Day) | ||||||||
| Decade | Year-0 | Year-1 | Year-2 | Year-3 | Year-4 | Year-5 | Year-6 | Year-7 | Year-8 | Year-9 |
|---|---|---|---|---|---|---|---|---|---|---|
| 1980's | W | W | W | 254.1 | 255.5 | 257.2 | 228.3 | |||
| 1990's | 240.9 | 224.2 | 213.6 | 210.7 | 226.3 | 211.4 | 206.9 | 229.5 | 229.7 | 261.9 |
| 2000's | 197.5 | 181.2 | 203.9 | 188.6 | 185.1 | 181.3 | 161.4 | 126.9 | 131.7 | 117.8 |
| 2010's | 148.2 | 247.0 | 212.5 | 108.2 | 95.8 | 96.9 | 95.6 | 95.2 | 95.6 | 95.7 |
| 2020's | 91.4 |
| - = No Data Reported; -- = Not Applicable; NA = Not Available; W = Withheld to avoid disclosure of individual company data. |
| Release Date: 6/1/2022 |
| Next Release Date: TBD |