|
Download Data (XLS File) |
|
||||||||
|
||||||||
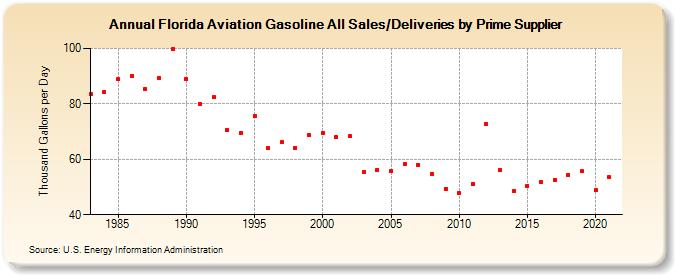
| Florida Aviation Gasoline All Sales/Deliveries by Prime Supplier (Thousand Gallons per Day) | ||||||||
| Decade | Year-0 | Year-1 | Year-2 | Year-3 | Year-4 | Year-5 | Year-6 | Year-7 | Year-8 | Year-9 |
|---|---|---|---|---|---|---|---|---|---|---|
| 1980's | 83.4 | 84.2 | 88.8 | 89.9 | 85.4 | 89.3 | 99.7 | |||
| 1990's | 88.8 | 80.1 | 82.5 | 70.7 | 69.5 | 75.6 | 64.0 | 66.1 | 64.1 | 68.6 |
| 2000's | 69.6 | 68.0 | 68.3 | 55.3 | 56.2 | 55.7 | 58.2 | 58.0 | 54.7 | 49.4 |
| 2010's | 47.8 | 51.2 | 72.9 | 56.3 | 48.5 | 50.4 | 51.7 | 52.6 | 54.3 | 55.6 |
| 2020's | 49.0 |
| - = No Data Reported; -- = Not Applicable; NA = Not Available; W = Withheld to avoid disclosure of individual company data. |
| Release Date: 6/1/2022 |
| Next Release Date: TBD |