|
Download Data (XLS File) |
|
||||||||
|
||||||||
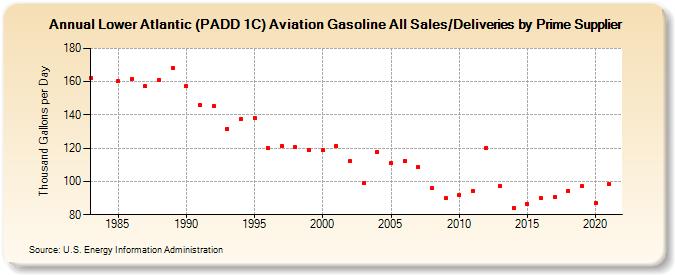
| Lower Atlantic (PADD 1C) Aviation Gasoline All Sales/Deliveries by Prime Supplier (Thousand Gallons per Day) | ||||||||
| Decade | Year-0 | Year-1 | Year-2 | Year-3 | Year-4 | Year-5 | Year-6 | Year-7 | Year-8 | Year-9 |
|---|---|---|---|---|---|---|---|---|---|---|
| 1980's | 162.2 | W | 160.2 | 161.7 | 157.1 | 161.2 | 168.2 | |||
| 1990's | 157.1 | 145.8 | 145.3 | 131.7 | 137.3 | 138.0 | 120.1 | 121.4 | 120.5 | 118.9 |
| 2000's | 118.8 | 121.3 | 112.1 | 99.0 | 117.7 | 110.9 | 112.5 | 108.8 | 96.0 | 89.8 |
| 2010's | 91.6 | 94.5 | 120.4 | 97.2 | 84.2 | 86.4 | 89.8 | 90.4 | 94.4 | 97.0 |
| 2020's | 86.8 |
| - = No Data Reported; -- = Not Applicable; NA = Not Available; W = Withheld to avoid disclosure of individual company data. |
| Release Date: 6/1/2022 |
| Next Release Date: TBD |