|
Download Data (XLS File) |
|
||||||||
|
||||||||
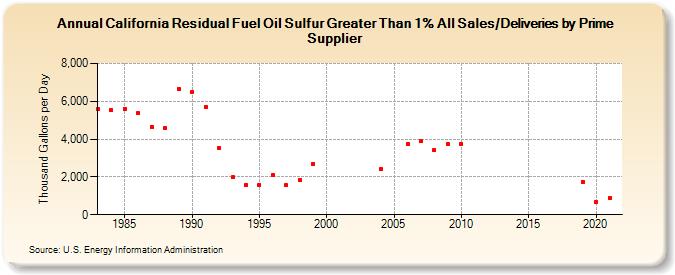
| California Residual Fuel Oil Sulfur Greater Than 1% All Sales/Deliveries by Prime Supplier (Thousand Gallons per Day) | ||||||||
| Decade | Year-0 | Year-1 | Year-2 | Year-3 | Year-4 | Year-5 | Year-6 | Year-7 | Year-8 | Year-9 |
|---|---|---|---|---|---|---|---|---|---|---|
| 1980's | 5,608.1 | 5,529.0 | 5,611.3 | 5,359.7 | 4,653.2 | 4,582.3 | 6,662.5 | |||
| 1990's | 6,482.7 | 5,714.0 | 3,523.5 | 1,969.4 | 1,580.6 | 1,584.7 | 2,101.5 | 1,554.8 | 1,838.2 | 2,686.4 |
| 2000's | W | W | W | W | 2,395.0 | W | 3,732.8 | 3,876.2 | 3,413.9 | 3,715.2 |
| 2010's | 3,757.7 | W | W | W | W | W | W | W | W | 1,742.3 |
| 2020's | 688.5 |
| - = No Data Reported; -- = Not Applicable; NA = Not Available; W = Withheld to avoid disclosure of individual company data. |
| Release Date: 6/1/2022 |
| Next Release Date: TBD |