|
Download Data (XLS File) |
|
||||||||
|
||||||||
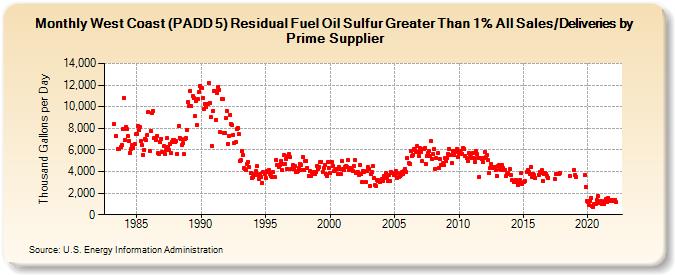
| West Coast (PADD 5) Residual Fuel Oil Sulfur Greater Than 1% All Sales/Deliveries by Prime Supplier (Thousand Gallons per Day) | ||||||||
| Year | Jan | Feb | Mar | Apr | May | Jun | Jul | Aug | Sep | Oct | Nov | Dec |
|---|---|---|---|---|---|---|---|---|---|---|---|---|
| 1983 | W | W | W | 8,368.6 | W | 7,272.6 | W | 6,118.3 | 6,066.6 | 6,226.1 | 6,425.5 | 7,891.3 |
| 1984 | 10,842.2 | 6,904.4 | 8,150.6 | 7,926.8 | 7,264.7 | 6,814.7 | 5,733.4 | 6,100.7 | 6,439.0 | 6,203.9 | 6,532.6 | 7,434.9 |
| 1985 | 7,476.6 | 8,191.3 | 7,822.6 | 8,123.7 | 6,813.9 | 6,413.3 | 5,570.4 | 6,026.1 | 7,038.8 | 6,915.9 | 7,406.5 | 9,486.7 |
| 1986 | 5,912.4 | 7,743.0 | 9,409.6 | 9,573.3 | 7,072.3 | 7,071.5 | 6,906.9 | 7,332.1 | 5,705.0 | 5,651.2 | 6,724.7 | 7,042.6 |
| 1987 | 5,835.0 | 6,334.6 | 5,603.6 | 5,982.2 | 7,068.9 | 6,298.6 | 6,017.7 | 6,563.9 | 5,702.7 | 6,767.5 | 6,942.0 | 6,924.6 |
| 1988 | 6,722.9 | 6,818.7 | 5,643.8 | 8,225.1 | 7,140.2 | 7,029.8 | 6,470.8 | 6,605.1 | 5,612.4 | 6,962.8 | 7,091.8 | 7,876.4 |
| 1989 | 10,421.2 | 10,041.0 | 11,450.8 | 10,039.2 | 11,026.9 | 10,767.8 | 9,112.7 | 10,525.7 | 8,304.8 | 10,674.7 | 11,383.2 | 11,934.9 |
| 1990 | 11,716.1 | 11,696.0 | 10,784.3 | 9,802.8 | 10,235.0 | 9,971.9 | 10,249.4 | 12,219.8 | 10,365.3 | 9,002.5 | 6,394.9 | 9,609.9 |
| 1991 | 11,477.2 | 11,496.4 | 8,777.5 | 11,244.6 | 11,867.9 | 11,574.9 | 7,632.4 | 10,750.2 | 10,680.1 | 7,610.4 | 7,529.1 | 8,963.1 |
| 1992 | 9,592.9 | 6,592.2 | 7,325.6 | 9,243.5 | 8,436.3 | 8,294.5 | 7,420.2 | 6,638.9 | 6,692.3 | 7,896.3 | 7,989.7 | 7,463.0 |
| 1993 | 4,950.9 | 5,061.4 | 5,938.8 | 5,540.1 | 4,308.6 | 4,189.0 | 4,099.9 | 4,660.2 | 4,856.8 | 4,422.0 | 3,853.6 | 3,405.1 |
| 1994 | 3,475.1 | 3,694.0 | 3,757.8 | 4,011.4 | 4,475.5 | 3,635.6 | 3,328.2 | 3,726.2 | 3,503.8 | 2,939.5 | 3,925.3 | 3,799.4 |
| 1995 | 3,383.4 | 4,033.0 | 3,981.9 | 4,138.7 | 3,740.2 | 3,618.3 | 3,471.4 | 3,913.9 | 3,497.8 | 3,467.2 | 5,056.0 | 4,633.2 |
| 1996 | 4,455.5 | 4,623.5 | 4,948.7 | 4,124.7 | 4,723.4 | 5,571.3 | 4,684.2 | 5,142.2 | 4,271.0 | 5,468.0 | 5,606.9 | 5,301.3 |
| 1997 | 4,240.9 | 4,607.0 | 4,244.8 | 4,540.0 | 3,994.5 | 3,953.9 | 4,047.1 | 4,325.7 | 4,722.4 | 4,625.7 | 4,119.8 | 5,341.8 |
| 1998 | 4,096.7 | 4,997.2 | 4,999.5 | 4,367.6 | 3,622.6 | 4,091.8 | 3,578.6 | 3,798.8 | 3,817.7 | 3,980.8 | 3,775.5 | 3,953.6 |
| 1999 | 4,534.6 | 4,229.0 | 4,403.4 | 4,890.9 | 4,920.5 | 3,979.8 | 4,341.5 | 4,600.0 | 3,740.4 | 3,555.9 | 4,834.6 | 4,365.0 |
| 2000 | 3,838.0 | 4,906.9 | 4,868.1 | 4,495.0 | 4,015.2 | 4,149.5 | 4,259.9 | 3,779.5 | 4,401.2 | 4,216.0 | 3,758.6 | 4,969.3 |
| 2001 | 4,233.6 | 4,097.7 | 4,403.2 | 4,542.7 | 4,441.7 | 5,063.0 | 4,101.4 | 4,317.3 | 4,109.6 | 4,039.9 | 4,507.6 | 5,033.8 |
| 2002 | 3,861.9 | 3,916.1 | 3,950.0 | 3,706.9 | 4,644.8 | 3,748.9 | 3,041.0 | 4,071.4 | 3,985.0 | 3,050.3 | 4,042.9 | 4,429.4 |
| 2003 | 4,262.9 | 2,677.0 | 3,742.9 | 3,925.6 | 4,508.0 | 3,393.7 | 2,728.7 | 2,650.5 | 3,249.0 | 3,156.4 | 3,052.3 | 3,223.5 |
| 2004 | 3,295.6 | 3,148.0 | 3,619.3 | 3,404.5 | 3,847.1 | 3,522.6 | 3,126.3 | 3,692.1 | 3,124.1 | 3,955.2 | 3,875.6 | 3,670.9 |
| 2005 | 3,759.5 | 4,043.3 | 3,442.8 | 3,826.3 | 3,461.3 | 3,611.5 | 3,717.8 | 3,928.4 | 3,768.6 | 4,014.5 | 4,270.1 | 3,934.2 |
| 2006 | 5,258.5 | 4,760.8 | 4,688.2 | 5,921.4 | 5,396.8 | 5,562.8 | 6,045.1 | 5,955.3 | 5,763.2 | 6,323.3 | 5,827.8 | 5,432.0 |
| 2007 | 6,129.8 | 5,841.3 | 4,928.6 | 6,060.1 | 6,163.4 | 4,734.8 | 5,472.0 | 5,682.8 | 5,911.3 | 5,425.3 | 6,786.5 | 5,203.2 |
| 2008 | 5,593.8 | 6,045.9 | 4,244.3 | 5,272.7 | 5,695.4 | 4,358.9 | 5,168.3 | 4,575.1 | 4,601.1 | 4,750.5 | 4,577.6 | 5,229.0 |
| 2009 | 4,988.9 | 5,231.0 | 5,662.9 | 6,095.7 | 5,569.2 | 4,807.3 | 5,916.2 | 5,564.5 | 5,807.5 | 5,873.3 | 6,058.9 | 5,333.0 |
| 2010 | 5,695.5 | 5,910.0 | 5,679.6 | 5,647.3 | 6,172.9 | 6,102.1 | 5,455.0 | 5,268.4 | 5,005.4 | 5,713.0 | 5,575.4 | 5,353.7 |
| 2011 | 5,228.8 | 5,728.4 | 5,253.3 | 4,901.3 | 5,933.8 | 5,585.7 | 5,235.9 | 3,536.3 | 5,288.5 | 5,129.7 | 4,901.5 | 5,287.5 |
| 2012 | 5,770.0 | 5,321.7 | 5,555.1 | 5,040.6 | 3,851.5 | 4,334.9 | 4,698.0 | 4,451.3 | 4,343.6 | 4,370.9 | 4,118.7 | 3,625.4 |
| 2013 | 4,466.7 | 4,577.4 | 4,209.4 | 4,173.8 | 4,569.1 | 4,328.1 | 4,181.8 | 4,165.4 | 3,540.1 | 3,724.6 | 3,822.3 | 4,196.9 |
| 2014 | 3,681.7 | 3,177.1 | W | 3,072.6 | 3,036.5 | 3,245.4 | 3,162.2 | 2,740.5 | 3,038.3 | 3,181.2 | 3,841.3 | 2,805.7 |
| 2015 | 2,993.4 | 3,123.8 | W | 3,953.7 | 4,139.0 | 3,986.8 | 3,788.2 | 4,418.1 | 3,512.0 | 3,796.8 | 3,666.1 | 3,381.9 |
| 2016 | W | W | 3,700.5 | 3,913.2 | 3,889.8 | 4,110.9 | 3,136.8 | 3,764.4 | 3,837.3 | 3,810.5 | 3,575.3 | 3,432.1 |
| 2017 | W | W | W | W | W | 3,340.8 | 3,724.1 | W | W | 3,776.8 | 3,855.2 | W |
| 2018 | W | W | W | W | W | W | W | 3,624.6 | W | W | W | 4,153.7 |
| 2019 | 3,672.1 | 3,526.5 | W | W | W | W | W | W | W | 3,698.5 | 2,588.6 | 1,259.9 |
| 2020 | 1,217.6 | 861.1 | 1,271.4 | 1,586.8 | 789.6 | 693.6 | 991.1 | 986.5 | 1,376.5 | 1,713.4 | 1,201.6 | 1,097.9 |
| 2021 | 1,307.5 | 1,002.3 | 1,098.0 | 1,026.1 | 1,247.3 | 1,426.0 | 1,181.5 | 1,549.0 | 1,331.8 | 1,282.4 | 1,345.3 | 1,266.3 |
| 2022 | 1,311.7 | 1,406.5 | 1,159.1 | |||||||||
| - = No Data Reported; -- = Not Applicable; NA = Not Available; W = Withheld to avoid disclosure of individual company data. |
| Release Date: 5/19/2022 |
| Next Release Date: TBD |