|
Download Data (XLS File) |
|
||||||||
|
||||||||
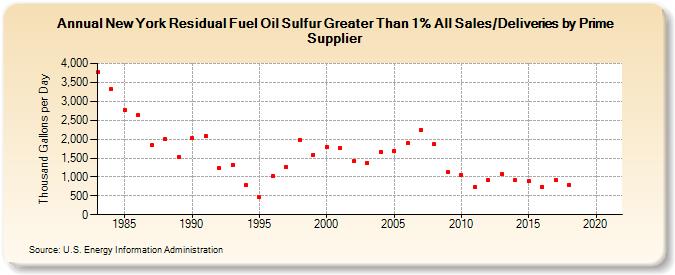
| New York Residual Fuel Oil Sulfur Greater Than 1% All Sales/Deliveries by Prime Supplier (Thousand Gallons per Day) | ||||||||
| Decade | Year-0 | Year-1 | Year-2 | Year-3 | Year-4 | Year-5 | Year-6 | Year-7 | Year-8 | Year-9 |
|---|---|---|---|---|---|---|---|---|---|---|
| 1980's | 3,764.2 | 3,317.0 | 2,766.8 | 2,628.1 | 1,835.4 | 1,998.4 | 1,516.4 | |||
| 1990's | 2,022.7 | 2,077.6 | 1,223.5 | 1,327.5 | 781.6 | 456.8 | 1,023.9 | 1,260.8 | 1,971.1 | 1,591.0 |
| 2000's | 1,779.5 | 1,770.2 | 1,409.4 | 1,364.5 | 1,658.1 | 1,683.3 | 1,883.8 | 2,245.2 | 1,858.5 | 1,122.7 |
| 2010's | 1,051.5 | 734.3 | 909.9 | 1,071.0 | 908.6 | 879.2 | 741.1 | 921.1 | 798.2 | W |
| 2020's | W |
| - = No Data Reported; -- = Not Applicable; NA = Not Available; W = Withheld to avoid disclosure of individual company data. |
| Release Date: 6/1/2022 |
| Next Release Date: TBD |