|
Download Data (XLS File) |
|
||||||||
|
||||||||
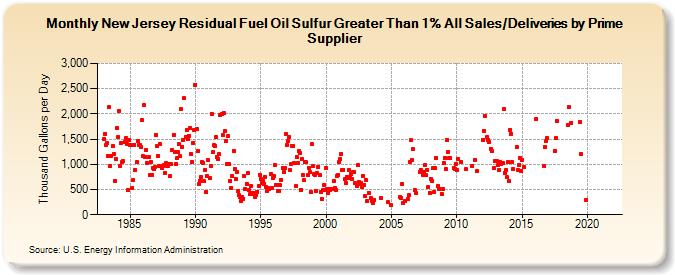
| New Jersey Residual Fuel Oil Sulfur Greater Than 1% All Sales/Deliveries by Prime Supplier (Thousand Gallons per Day) | ||||||||
| Year | Jan | Feb | Mar | Apr | May | Jun | Jul | Aug | Sep | Oct | Nov | Dec |
|---|---|---|---|---|---|---|---|---|---|---|---|---|
| 1983 | 1,505.6 | 1,606.8 | 1,387.4 | 1,429.5 | 1,166.6 | 2,139.1 | 965.2 | 1,171.8 | 1,359.3 | 1,209.1 | 674.8 | 1,111.0 |
| 1984 | 1,712.2 | 1,540.2 | 2,059.0 | 958.7 | 1,428.1 | 1,039.1 | 1,057.1 | 1,450.7 | 1,512.8 | 1,398.8 | 483.5 | 1,489.0 |
| 1985 | 1,389.1 | 1,374.5 | 529.6 | 683.2 | 1,388.0 | 888.2 | 1,041.9 | 1,456.1 | 1,383.5 | 1,373.5 | 1,347.2 | 1,870.7 |
| 1986 | 1,159.1 | 2,175.8 | 1,147.2 | 1,281.4 | 1,017.7 | 1,139.1 | 785.1 | 1,045.9 | 792.8 | 923.8 | 899.8 | 937.3 |
| 1987 | 1,582.3 | 1,355.0 | 1,165.2 | 966.6 | 1,394.4 | 919.4 | 965.4 | 978.8 | 830.5 | 1,021.7 | 968.3 | 969.8 |
| 1988 | 1,013.5 | 770.6 | 997.5 | 1,275.5 | 1,586.9 | 1,245.1 | 1,012.8 | 1,116.3 | 1,241.2 | 1,395.5 | 1,158.0 | 2,087.8 |
| 1989 | 1,346.7 | 1,480.3 | 2,313.8 | 1,550.5 | 1,679.8 | 1,501.2 | 1,569.6 | 1,721.7 | 1,212.4 | 1,048.0 | 1,430.1 | 1,678.3 |
| 1990 | 2,579.5 | 1,699.9 | 1,259.0 | 600.9 | 675.7 | 746.5 | 1,043.5 | 1,034.0 | 659.9 | 885.6 | 444.9 | 763.4 |
| 1991 | 1,076.2 | 719.0 | 967.8 | 2,007.4 | 1,234.7 | 1,374.0 | 1,371.3 | 1,540.1 | 1,153.6 | 1,113.2 | 1,194.8 | 1,987.0 |
| 1992 | 1,997.8 | 1,576.9 | 2,025.4 | 1,658.4 | 1,465.7 | 1,007.4 | 1,562.5 | 1,009.7 | 672.6 | 539.5 | 764.3 | 1,265.3 |
| 1993 | 902.0 | 713.2 | 846.1 | 465.2 | 395.1 | 361.0 | 271.9 | 355.1 | 320.0 | 761.9 | 508.8 | 614.6 |
| 1994 | 828.4 | 488.3 | 404.7 | 570.1 | 421.5 | 418.5 | 438.2 | 358.0 | 394.3 | 456.6 | 569.2 | 789.1 |
| 1995 | 707.3 | 623.8 | 671.5 | 612.6 | 751.7 | 543.5 | 478.6 | 520.9 | 517.5 | 803.9 | 529.3 | 736.4 |
| 1996 | 768.1 | 986.9 | 594.9 | 583.3 | 470.3 | 479.1 | 584.1 | 692.5 | 919.4 | 844.8 | 934.7 | 1,597.5 |
| 1997 | 1,383.9 | 1,467.8 | 1,549.4 | 886.7 | 1,000.7 | 1,358.9 | 1,353.6 | 1,023.4 | 560.9 | 1,148.1 | 1,027.6 | 1,264.5 |
| 1998 | 1,215.7 | 491.0 | 1,109.3 | 783.4 | 682.5 | 1,045.8 | 1,037.1 | 782.3 | 927.7 | 840.7 | 449.8 | 1,396.0 |
| 1999 | 970.5 | 814.0 | 783.1 | 478.4 | 823.4 | 954.7 | 788.3 | 447.6 | 319.1 | 485.2 | 586.0 | 496.1 |
| 2000 | 931.4 | 517.8 | 431.9 | 500.4 | 483.4 | 507.8 | 512.4 | 667.6 | 535.5 | 494.2 | 769.2 | 782.1 |
| 2001 | 1,048.3 | 1,100.5 | 1,206.3 | 888.8 | 896.9 | 702.0 | 630.8 | 751.8 | 727.1 | 891.1 | 747.1 | 815.9 |
| 2002 | 713.4 | 848.6 | 851.2 | 621.6 | 574.3 | 984.2 | 655.0 | 617.0 | 636.8 | 543.4 | 760.8 | 596.6 |
| 2003 | 370.2 | 682.1 | 272.0 | 438.9 | W | 333.9 | 275.4 | 236.8 | 289.2 | W | W | W |
| 2004 | W | W | 329.0 | W | W | W | W | W | W | 243.2 | W | W |
| 2005 | 183.7 | W | W | W | W | W | W | W | 347.4 | 340.7 | 613.8 | 242.2 |
| 2006 | 275.0 | W | W | 315.5 | 381.4 | 1,050.2 | 1,474.2 | 1,085.1 | 1,297.6 | W | 483.4 | 423.0 |
| 2007 | W | W | 848.2 | 888.5 | W | 789.0 | 842.3 | 981.5 | 778.4 | 894.7 | 544.5 | 440.3 |
| 2008 | 717.6 | 675.2 | 919.0 | 444.2 | 923.6 | 1,125.6 | W | 578.7 | 516.1 | W | 420.2 | 512.5 |
| 2009 | 1,030.9 | 1,129.0 | 911.3 | 1,486.3 | 1,251.1 | 1,133.2 | 1,130.5 | W | W | 929.9 | 915.5 | 1,015.1 |
| 2010 | 885.7 | 1,105.9 | W | W | 1,055.1 | W | W | W | 898.6 | W | W | W |
| 2011 | W | W | 961.9 | W | W | 1,087.0 | W | 862.8 | W | W | W | W |
| 2012 | 1,485.7 | 1,665.2 | 1,965.3 | W | 1,539.6 | 1,489.1 | 1,440.5 | 1,309.1 | 1,265.4 | W | 929.7 | 1,070.1 |
| 2013 | W | 1,057.8 | 977.9 | 891.5 | 1,036.4 | 1,002.5 | 1,034.6 | 2,101.1 | 831.1 | 879.5 | 739.9 | 1,037.2 |
| 2014 | 663.3 | 1,688.0 | 1,606.3 | 1,037.2 | 908.1 | W | W | 1,353.0 | 893.3 | 995.9 | 1,125.4 | 875.2 |
| 2015 | 1,091.6 | W | 943.2 | W | W | W | W | W | W | W | W | W |
| 2016 | W | 1,901.1 | W | W | W | W | W | W | 967.4 | 1,341.7 | 1,469.0 | 1,521.7 |
| 2017 | W | W | W | W | W | W | 1,273.3 | 1,519.3 | 1,861.9 | W | W | W |
| 2018 | W | W | W | W | W | W | 1,787.7 | 2,142.6 | W | 1,826.9 | W | W |
| 2019 | W | W | W | W | W | 1,846.6 | 1,208.4 | W | W | W | W | 292.7 |
| 2020 | W | W | W | - | - | W | W | NA | W | W | W | W |
| 2021 | W | W | W | W | W | W | W | W | W | W | W | W |
| 2022 | W | W | W | |||||||||
| - = No Data Reported; -- = Not Applicable; NA = Not Available; W = Withheld to avoid disclosure of individual company data. |
| Release Date: 5/19/2022 |
| Next Release Date: TBD |