|
Download Data (XLS File) |
|
||||||||
|
||||||||
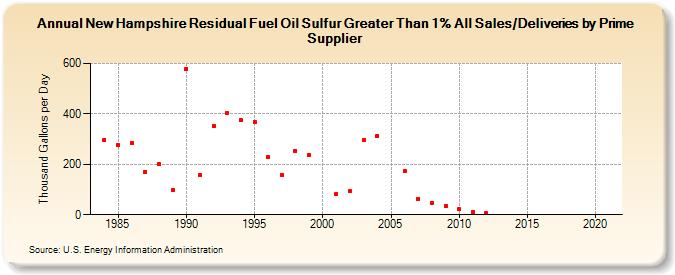
| New Hampshire Residual Fuel Oil Sulfur Greater Than 1% All Sales/Deliveries by Prime Supplier (Thousand Gallons per Day) | ||||||||
| Decade | Year-0 | Year-1 | Year-2 | Year-3 | Year-4 | Year-5 | Year-6 | Year-7 | Year-8 | Year-9 |
|---|---|---|---|---|---|---|---|---|---|---|
| 1980's | W | 297.6 | 277.5 | 283.8 | 170.4 | 199.4 | 96.4 | |||
| 1990's | 577.9 | 157.1 | 352.2 | 403.5 | 375.4 | 369.8 | 228.3 | 159.0 | 253.2 | 237.0 |
| 2000's | W | 82.8 | 92.8 | 296.9 | 312.4 | W | 172.7 | 63.5 | 47.2 | 34.4 |
| 2010's | 21.2 | 9.4 | 5.7 | W | W | W | W | W | W | - |
| 2020's | - |
| - = No Data Reported; -- = Not Applicable; NA = Not Available; W = Withheld to avoid disclosure of individual company data. |
| Release Date: 6/1/2022 |
| Next Release Date: TBD |