|
Download Data (XLS File) |
|
||||||||
|
||||||||
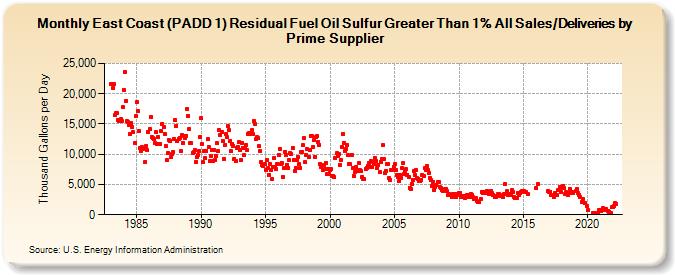
| East Coast (PADD 1) Residual Fuel Oil Sulfur Greater Than 1% All Sales/Deliveries by Prime Supplier (Thousand Gallons per Day) | ||||||||
| Year | Jan | Feb | Mar | Apr | May | Jun | Jul | Aug | Sep | Oct | Nov | Dec |
|---|---|---|---|---|---|---|---|---|---|---|---|---|
| 1983 | 21,665.0 | 21,611.3 | 20,986.6 | 21,565.4 | 16,402.2 | 16,735.5 | 16,735.6 | 15,655.3 | 15,439.7 | 15,754.1 | 15,449.8 | 17,779.3 |
| 1984 | 20,657.7 | 23,661.5 | 18,821.4 | 15,437.1 | 15,270.1 | 14,835.7 | 13,361.3 | 15,104.4 | 14,541.5 | 13,669.1 | 11,836.5 | 16,240.7 |
| 1985 | 18,567.6 | 17,110.8 | 13,880.2 | 10,968.2 | 10,472.0 | 11,121.5 | 10,842.6 | 11,040.2 | 8,734.7 | 11,358.6 | 10,635.6 | 13,643.2 |
| 1986 | 14,179.8 | 16,117.6 | 12,825.1 | 12,632.9 | 12,560.5 | 11,906.3 | 13,679.5 | 11,737.8 | 12,874.0 | 11,608.2 | 11,670.8 | 13,814.2 |
| 1987 | 15,024.4 | 14,506.5 | 13,364.4 | 11,352.5 | 9,006.5 | 10,188.8 | 12,410.8 | 12,233.8 | 9,471.9 | 10,110.4 | 10,357.2 | 12,497.5 |
| 1988 | 15,624.6 | 14,731.7 | 12,208.9 | 12,441.3 | 12,692.1 | 10,476.5 | 13,149.0 | 11,881.2 | 13,000.7 | 12,746.2 | 13,057.7 | 17,477.6 |
| 1989 | 16,360.7 | 14,117.3 | 11,819.9 | 11,817.5 | 10,208.7 | 10,342.9 | 10,674.6 | 8,774.1 | 9,482.8 | 9,819.0 | 10,602.7 | 12,928.1 |
| 1990 | 15,943.5 | 11,626.4 | 8,636.5 | 10,462.2 | 9,315.8 | 10,547.8 | 12,452.7 | 11,196.9 | 8,817.8 | 9,701.9 | 10,734.8 | 8,904.4 |
| 1991 | 10,692.7 | 9,040.8 | 9,697.2 | 11,783.2 | 10,512.4 | 13,982.9 | 13,168.5 | 13,715.5 | 12,157.0 | 9,221.4 | 11,490.5 | 13,264.1 |
| 1992 | 12,803.2 | 14,593.2 | 14,032.9 | 12,203.2 | 10,450.1 | 11,729.7 | 11,408.3 | 9,286.0 | 8,808.7 | 11,074.4 | 11,267.0 | 11,967.1 |
| 1993 | 10,668.1 | 9,037.8 | 11,884.6 | 11,040.6 | 9,820.7 | 10,998.7 | 11,564.3 | 10,621.8 | 13,335.1 | 13,437.7 | 13,323.9 | 13,943.5 |
| 1994 | 13,342.1 | 15,465.3 | 14,957.7 | 12,498.8 | 12,776.9 | 12,714.1 | 11,305.1 | 10,534.1 | 8,770.4 | 8,194.0 | 8,065.7 | 8,390.4 |
| 1995 | 7,404.4 | 9,083.4 | 7,753.8 | 6,626.1 | 8,429.5 | 7,334.4 | 5,868.7 | 7,806.1 | 9,382.3 | 7,807.9 | 7,538.4 | 8,455.9 |
| 1996 | 9,894.7 | 10,890.5 | 8,329.0 | 8,563.0 | 6,239.5 | 7,650.4 | 10,428.9 | 9,943.3 | 8,271.1 | 7,786.8 | 8,966.2 | 10,188.7 |
| 1997 | 10,069.1 | 11,077.0 | 8,986.0 | 7,247.9 | 7,761.0 | 9,051.2 | 9,587.0 | 8,304.6 | 7,750.7 | 10,290.9 | 10,396.7 | 11,461.4 |
| 1998 | 12,665.7 | 8,652.1 | 9,860.3 | 10,792.2 | 9,512.0 | 10,691.2 | 13,065.8 | 12,971.4 | 11,191.7 | 12,348.0 | 9,609.7 | 12,793.3 |
| 1999 | 12,943.6 | 12,022.2 | 11,585.6 | 8,347.4 | 7,866.2 | 7,468.5 | 8,244.7 | 7,571.4 | 8,603.8 | 6,665.9 | 7,629.5 | 6,670.7 |
| 2000 | 7,412.7 | 7,484.2 | 6,476.8 | 6,386.6 | 6,201.3 | 9,296.7 | 10,138.7 | 9,770.7 | 10,026.3 | 8,250.1 | 8,968.8 | 11,231.1 |
| 2001 | 13,343.1 | 11,908.2 | 10,472.9 | 10,939.8 | 11,482.8 | 9,824.8 | 8,322.2 | 8,303.4 | 9,928.5 | 7,791.2 | 6,469.1 | 7,026.9 |
| 2002 | 7,860.8 | 7,364.5 | 7,173.2 | 8,466.3 | 7,346.7 | 7,156.8 | 6,276.4 | 5,960.5 | 5,859.8 | 7,573.4 | 7,790.0 | 8,107.7 |
| 2003 | 8,526.7 | 7,877.4 | 8,798.7 | 7,873.3 | 8,738.2 | 8,466.1 | 9,355.3 | 8,850.4 | 7,727.0 | 8,199.7 | 7,018.5 | 8,792.3 |
| 2004 | 9,247.0 | 11,461.2 | 9,137.4 | 6,910.4 | 7,275.3 | 8,385.5 | 8,435.2 | 5,999.8 | 5,758.5 | 7,321.9 | 7,433.6 | 7,890.5 |
| 2005 | 8,347.0 | 7,316.3 | 6,592.1 | 6,295.9 | 5,524.7 | 6,579.3 | 6,087.9 | 7,717.7 | 8,546.8 | 6,710.9 | 7,308.5 | 7,479.8 |
| 2006 | 6,609.7 | 6,307.3 | 4,484.8 | 4,193.7 | 5,114.4 | 5,815.2 | 7,160.7 | 6,618.7 | 7,361.6 | 6,004.9 | 5,940.0 | 5,573.5 |
| 2007 | 5,556.6 | 5,760.5 | 6,548.3 | 6,431.4 | 7,651.9 | 7,369.2 | 8,071.6 | 7,311.0 | 6,904.2 | 6,089.2 | 5,713.9 | 4,790.0 |
| 2008 | 5,440.0 | 4,163.9 | 4,582.0 | 4,905.1 | 5,418.5 | 5,465.4 | 4,624.7 | 4,392.3 | 4,066.6 | 3,954.6 | 3,961.9 | 4,269.1 |
| 2009 | 4,287.0 | 3,847.8 | 3,237.9 | 3,420.0 | 3,229.0 | 2,894.4 | 3,435.0 | 3,346.6 | 3,478.9 | 2,919.5 | 3,185.0 | 3,390.4 |
| 2010 | 3,560.7 | 3,635.8 | 2,965.4 | 2,983.1 | 3,085.9 | 3,110.6 | 2,794.2 | 3,186.8 | 3,201.3 | 2,939.1 | 2,867.1 | 3,447.8 |
| 2011 | 3,280.7 | 2,908.1 | 2,552.8 | 2,770.7 | 2,730.3 | 2,218.2 | 2,126.7 | 2,121.6 | 2,668.5 | 3,736.1 | 3,507.1 | 3,706.6 |
| 2012 | 3,556.4 | 3,654.4 | 3,983.6 | 3,538.4 | 3,448.6 | 3,728.4 | 3,944.2 | 3,523.8 | 3,333.4 | 3,006.4 | 2,927.0 | 3,131.3 |
| 2013 | 3,381.4 | 3,343.0 | 3,191.6 | 3,150.7 | 3,133.6 | 2,996.4 | 3,400.2 | 5,067.5 | 3,456.0 | 3,878.3 | 3,269.1 | 3,448.2 |
| 2014 | 3,318.6 | 4,070.1 | 3,752.9 | 2,977.5 | 2,801.8 | 2,828.8 | 2,841.2 | 3,556.5 | 3,233.8 | 3,526.4 | 3,798.5 | 3,948.4 |
| 2015 | 3,946.6 | 3,685.5 | 3,728.1 | W | 3,389.5 | W | W | W | W | W | W | W |
| 2016 | 4,359.4 | 5,043.2 | W | W | W | W | W | W | W | W | W | 3,945.6 |
| 2017 | 3,781.9 | 3,831.7 | 3,237.7 | W | 2,894.3 | 3,604.3 | 3,246.1 | 3,199.4 | 4,013.3 | W | 4,520.4 | 3,751.3 |
| 2018 | 4,441.3 | 4,828.5 | 4,401.0 | 3,459.0 | 3,727.5 | 3,284.4 | 3,547.0 | 4,295.2 | 3,508.8 | 3,818.3 | 3,583.7 | W |
| 2019 | W | 3,934.8 | 4,225.2 | 3,602.9 | 3,324.5 | 2,954.8 | 2,079.3 | 2,546.7 | W | 1,884.0 | W | 1,440.4 |
| 2020 | 718.6 | W | W | W | W | 228.7 | 203.6 | 202.6 | 271.5 | 321.3 | 763.7 | 827.5 |
| 2021 | 585.1 | W | 1,059.8 | 829.0 | W | 892.6 | W | 669.0 | 524.2 | 307.4 | 1,259.5 | 1,268.3 |
| 2022 | 1,506.2 | 1,908.1 | 1,798.8 | |||||||||
| - = No Data Reported; -- = Not Applicable; NA = Not Available; W = Withheld to avoid disclosure of individual company data. |
| Release Date: 5/19/2022 |
| Next Release Date: TBD |