|
Download Data (XLS File) |
|
||||||||
|
||||||||
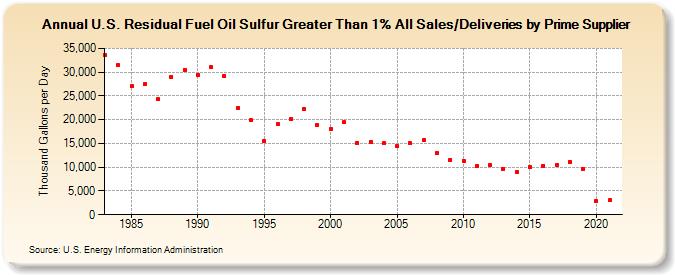
| U.S. Residual Fuel Oil Sulfur Greater Than 1% All Sales/Deliveries by Prime Supplier (Thousand Gallons per Day) | ||||||||
| Decade | Year-0 | Year-1 | Year-2 | Year-3 | Year-4 | Year-5 | Year-6 | Year-7 | Year-8 | Year-9 |
|---|---|---|---|---|---|---|---|---|---|---|
| 1980's | 33,713.5 | 31,401.6 | 27,063.7 | 27,439.2 | 24,286.3 | 29,041.7 | 30,515.4 | |||
| 1990's | 29,474.2 | 31,073.3 | 29,213.4 | 22,528.0 | 19,861.4 | 15,588.0 | 18,995.9 | 20,140.0 | 22,329.4 | 18,905.7 |
| 2000's | 18,040.2 | 19,466.3 | 15,154.8 | 15,379.6 | 15,037.2 | 14,395.6 | 15,010.8 | 15,643.5 | 12,907.7 | 11,615.1 |
| 2010's | 11,304.5 | 10,173.3 | 10,458.9 | 9,700.5 | 9,010.0 | 10,012.9 | 10,310.2 | 10,510.8 | 11,180.8 | 9,711.3 |
| 2020's | 2,822.2 |
| - = No Data Reported; -- = Not Applicable; NA = Not Available; W = Withheld to avoid disclosure of individual company data. |
| Release Date: 6/1/2022 |
| Next Release Date: TBD |