|
Download Data (XLS File) |
|
||||||||
|
||||||||
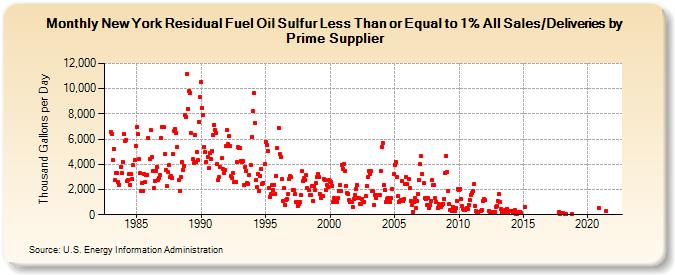
| New York Residual Fuel Oil Sulfur Less Than or Equal to 1% All Sales/Deliveries by Prime Supplier (Thousand Gallons per Day) | ||||||||
| Year | Jan | Feb | Mar | Apr | May | Jun | Jul | Aug | Sep | Oct | Nov | Dec |
|---|---|---|---|---|---|---|---|---|---|---|---|---|
| 1983 | 6,570.8 | 6,403.8 | 4,318.9 | 5,237.4 | 2,718.4 | 3,313.7 | 3,315.7 | 2,568.3 | 2,395.5 | 3,815.9 | 3,292.4 | 4,192.8 |
| 1984 | 6,439.5 | 5,835.2 | 5,955.5 | 2,636.4 | 2,752.8 | 3,199.9 | 2,394.6 | 3,237.1 | 2,854.8 | 3,920.7 | 4,314.8 | 5,454.8 |
| 1985 | 6,988.8 | 6,396.2 | 4,414.0 | 3,282.8 | 1,919.3 | 2,497.8 | 1,920.2 | 3,216.0 | 2,586.9 | 3,113.4 | 3,166.9 | 6,084.3 |
| 1986 | 4,433.1 | 6,689.1 | 4,564.0 | 3,499.6 | 2,081.1 | 2,648.2 | 3,468.9 | 3,793.0 | 2,749.5 | 2,942.3 | 3,137.0 | 6,106.0 |
| 1987 | 6,936.9 | 6,978.3 | 4,829.3 | 3,532.1 | 2,283.8 | 3,374.8 | 3,907.0 | 2,982.3 | 3,084.8 | 2,883.8 | 4,782.2 | 6,620.0 |
| 1988 | 6,805.2 | 6,474.9 | 5,391.4 | 2,755.8 | 1,905.4 | 2,956.2 | 4,175.0 | 3,577.3 | 3,865.1 | 7,913.1 | 7,780.8 | 11,168.2 |
| 1989 | 8,414.9 | 9,829.2 | 9,661.5 | 6,494.0 | 4,391.4 | 4,100.8 | 6,304.4 | 4,183.1 | 5,000.6 | 4,304.6 | 7,368.0 | 9,322.8 |
| 1990 | 10,530.6 | 8,479.7 | 7,904.0 | 5,379.3 | 4,947.4 | 4,200.0 | 4,603.0 | 3,688.9 | 4,899.6 | 4,449.3 | 5,049.1 | 6,321.6 |
| 1991 | 7,151.3 | 6,737.9 | 6,504.0 | 4,004.7 | 2,772.2 | 2,993.2 | 3,758.7 | 4,467.8 | 3,645.4 | 3,307.0 | 3,543.1 | 5,435.6 |
| 1992 | 6,683.0 | 5,600.7 | 6,218.5 | 5,429.4 | 3,084.5 | 2,906.6 | 3,344.9 | 2,560.5 | 2,563.6 | 4,158.2 | 5,365.8 | 5,258.1 |
| 1993 | 5,323.8 | 4,271.3 | 4,180.0 | 4,230.1 | 2,360.8 | 3,814.3 | 3,501.3 | 2,532.3 | 2,472.3 | 3,180.5 | 3,963.6 | 6,158.8 |
| 1994 | 8,194.0 | 9,661.0 | 7,279.5 | 2,754.9 | 2,187.1 | 3,191.8 | 1,908.6 | 3,109.8 | 3,606.2 | 2,427.2 | 2,541.1 | 4,012.8 |
| 1995 | 5,793.1 | 5,546.4 | 5,065.0 | 2,109.9 | 1,370.5 | 1,604.2 | 2,335.2 | 1,983.2 | 2,389.3 | 1,654.5 | 3,098.1 | 5,259.1 |
| 1996 | 6,902.7 | 4,794.7 | 4,572.3 | 2,824.4 | 1,078.9 | 2,085.3 | 809.0 | 1,145.8 | 1,263.1 | 1,673.2 | 2,809.7 | 3,059.9 |
| 1997 | 2,977.5 | 1,960.7 | 1,945.2 | 1,616.7 | 973.0 | 981.7 | 730.4 | 877.6 | 975.6 | 1,563.9 | 3,431.5 | 2,690.4 |
| 1998 | 2,879.7 | 2,791.9 | 3,162.5 | 2,123.3 | 1,926.6 | 1,572.9 | 1,543.4 | 2,263.8 | 1,107.7 | 2,304.8 | 1,945.0 | 2,519.8 |
| 1999 | 3,025.3 | 3,215.2 | 3,024.5 | 1,636.9 | 1,325.9 | 1,466.1 | 2,795.1 | 2,720.9 | 1,994.5 | 2,370.1 | 2,213.4 | 2,718.3 |
| 2000 | 2,655.5 | 2,597.9 | 2,314.9 | 991.0 | 1,314.8 | 1,230.6 | 979.4 | 1,289.1 | 1,892.6 | 2,350.9 | 1,858.7 | 3,971.1 |
| 2001 | 3,639.3 | 4,044.6 | 3,491.0 | 2,281.4 | 1,742.5 | 1,673.1 | 1,202.6 | 1,008.3 | 1,036.7 | 613.6 | 1,247.1 | 1,576.1 |
| 2002 | 2,079.8 | 2,338.6 | 1,343.1 | 1,322.6 | 818.8 | 883.7 | 1,261.3 | 1,041.0 | 1,029.0 | 1,463.3 | 2,290.2 | 2,969.4 |
| 2003 | 3,440.3 | 3,246.5 | 3,449.6 | 1,906.5 | 1,842.6 | 754.9 | 1,538.5 | 1,345.4 | 1,595.1 | 1,527.6 | 1,536.6 | 3,431.3 |
| 2004 | 5,398.6 | 5,657.6 | 2,389.4 | 1,949.7 | 993.5 | 1,260.2 | 1,316.5 | 1,231.5 | 1,018.3 | 1,326.5 | 2,007.9 | 3,202.6 |
| 2005 | 3,976.3 | 4,202.8 | 2,990.7 | 1,445.9 | 1,040.2 | 1,106.3 | 1,132.2 | 2,654.4 | 1,053.1 | 1,233.6 | 2,435.3 | 2,975.5 |
| 2006 | 2,401.3 | 2,802.8 | 2,084.7 | 1,107.6 | 744.1 | 239.3 | 1,044.4 | 1,325.0 | 543.8 | 1,119.0 | 1,659.9 | 2,719.4 |
| 2007 | 3,989.9 | 4,624.4 | 3,230.4 | 2,495.3 | 1,289.6 | 1,214.4 | 803.4 | 1,301.2 | 529.9 | 780.2 | 1,100.0 | 2,756.2 |
| 2008 | 2,386.0 | 2,373.8 | 1,310.6 | 1,023.3 | 503.1 | 849.3 | 607.3 | 626.1 | 734.6 | 850.7 | 1,279.5 | 3,283.6 |
| 2009 | 4,660.0 | 3,427.6 | 1,910.5 | 827.4 | 412.8 | 266.0 | 651.0 | 447.9 | 277.3 | 566.3 | 1,090.3 | 2,008.0 |
| 2010 | 1,998.6 | 2,070.1 | 1,212.5 | 656.5 | 462.6 | 353.0 | 384.3 | 508.8 | 492.7 | 808.4 | 1,176.3 | 1,566.4 |
| 2011 | 1,709.3 | 1,851.0 | 2,446.4 | 692.9 | 284.5 | 248.6 | 213.1 | W | 260.4 | 402.7 | 1,100.3 | 1,238.8 |
| 2012 | 1,139.6 | W | W | W | 260.8 | 187.1 | 195.9 | 197.7 | 190.3 | 250.1 | 626.4 | 718.8 |
| 2013 | 1,115.5 | 1,634.6 | 1,009.8 | 428.2 | 209.5 | 120.9 | 187.4 | 372.1 | 261.8 | 429.7 | 227.5 | 261.4 |
| 2014 | 316.5 | 314.0 | 213.7 | 174.5 | 341.1 | 87.1 | 60.3 | W | 201.1 | 221.3 | 108.7 | W |
| 2015 | W | 612.7 | W | W | W | W | W | W | W | W | W | W |
| 2016 | W | W | W | W | W | W | W | W | W | W | W | W |
| 2017 | W | W | W | W | W | W | W | W | W | 215.4 | 85.1 | W |
| 2018 | 136.7 | 133.9 | W | 39.3 | 18.2 | W | W | W | W | 21.0 | W | W |
| 2019 | W | W | W | W | W | W | W | W | W | W | W | W |
| 2020 | W | W | W | W | W | W | W | W | W | W | 539.9 | W |
| 2021 | W | W | W | W | W | 260.4 | W | W | W | W | W | W |
| 2022 | W | W | W | |||||||||
| - = No Data Reported; -- = Not Applicable; NA = Not Available; W = Withheld to avoid disclosure of individual company data. |
| Release Date: 5/19/2022 |
| Next Release Date: TBD |