|
Download Data (XLS File) |
|
||||||||
|
||||||||
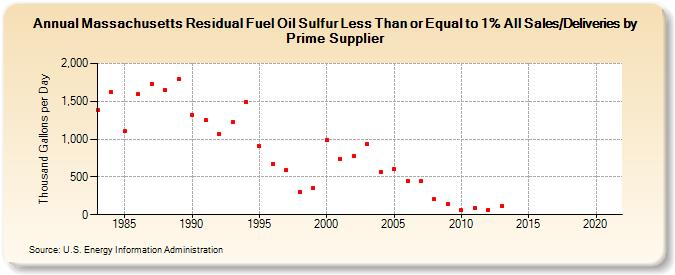
| Massachusetts Residual Fuel Oil Sulfur Less Than or Equal to 1% All Sales/Deliveries by Prime Supplier (Thousand Gallons per Day) | ||||||||
| Decade | Year-0 | Year-1 | Year-2 | Year-3 | Year-4 | Year-5 | Year-6 | Year-7 | Year-8 | Year-9 |
|---|---|---|---|---|---|---|---|---|---|---|
| 1980's | 1,381.7 | 1,618.6 | 1,102.7 | 1,592.4 | 1,732.2 | 1,646.6 | 1,800.2 | |||
| 1990's | 1,324.7 | 1,247.8 | 1,062.2 | 1,225.8 | 1,492.9 | 909.7 | 674.4 | 590.6 | 303.5 | 350.0 |
| 2000's | 987.5 | 740.1 | 772.5 | 930.1 | 569.6 | 605.9 | 446.4 | 439.7 | 204.0 | 140.7 |
| 2010's | 58.4 | 88.2 | 68.2 | 121.4 | W | W | W | W | W | W |
| 2020's | W |
| - = No Data Reported; -- = Not Applicable; NA = Not Available; W = Withheld to avoid disclosure of individual company data. |
| Release Date: 6/1/2022 |
| Next Release Date: TBD |