|
Download Data (XLS File) |
|
||||||||
|
||||||||
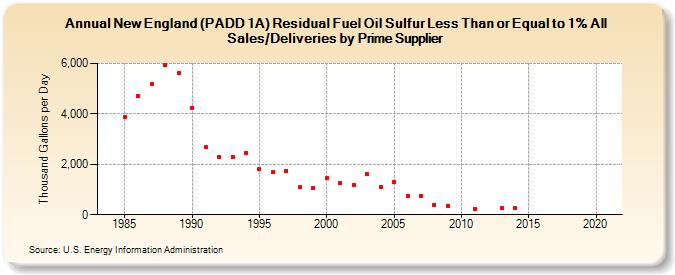
| New England (PADD 1A) Residual Fuel Oil Sulfur Less Than or Equal to 1% All Sales/Deliveries by Prime Supplier (Thousand Gallons per Day) | ||||||||
| Decade | Year-0 | Year-1 | Year-2 | Year-3 | Year-4 | Year-5 | Year-6 | Year-7 | Year-8 | Year-9 |
|---|---|---|---|---|---|---|---|---|---|---|
| 1980's | W | W | 3,891.4 | 4,699.3 | 5,168.0 | 5,954.7 | 5,606.1 | |||
| 1990's | 4,249.4 | 2,675.3 | 2,296.3 | 2,308.9 | 2,463.0 | 1,816.3 | 1,682.3 | 1,746.7 | 1,094.3 | 1,052.3 |
| 2000's | 1,453.9 | 1,246.0 | 1,173.2 | 1,614.5 | 1,089.8 | 1,294.9 | 740.3 | 746.6 | 395.0 | 351.5 |
| 2010's | W | 241.2 | W | 258.4 | 272.0 | W | W | W | W | W |
| 2020's | W |
| - = No Data Reported; -- = Not Applicable; NA = Not Available; W = Withheld to avoid disclosure of individual company data. |
| Release Date: 6/1/2022 |
| Next Release Date: TBD |