|
Download Data (XLS File) |
|
||||||||
|
||||||||
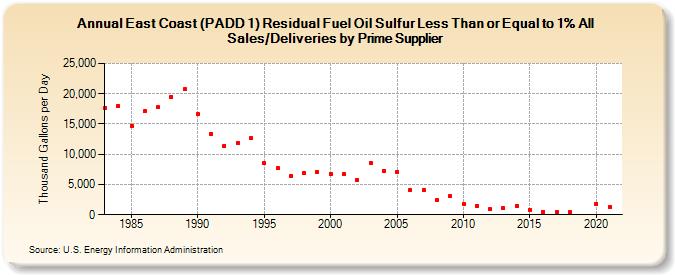
| East Coast (PADD 1) Residual Fuel Oil Sulfur Less Than or Equal to 1% All Sales/Deliveries by Prime Supplier (Thousand Gallons per Day) | ||||||||
| Decade | Year-0 | Year-1 | Year-2 | Year-3 | Year-4 | Year-5 | Year-6 | Year-7 | Year-8 | Year-9 |
|---|---|---|---|---|---|---|---|---|---|---|
| 1980's | 17,666.2 | 18,042.3 | 14,740.4 | 17,088.4 | 17,738.6 | 19,515.5 | 20,700.8 | |||
| 1990's | 16,569.5 | 13,323.4 | 11,424.0 | 11,880.9 | 12,626.0 | 8,478.7 | 7,681.2 | 6,456.2 | 6,895.4 | 7,064.3 |
| 2000's | 6,734.6 | 6,654.0 | 5,742.3 | 8,597.3 | 7,294.9 | 7,103.9 | 4,109.6 | 4,100.9 | 2,426.7 | 3,029.3 |
| 2010's | 1,714.4 | 1,486.1 | 897.4 | 1,083.3 | 1,403.6 | 832.5 | 527.3 | 440.8 | 403.6 | W |
| 2020's | 1,802.9 |
| - = No Data Reported; -- = Not Applicable; NA = Not Available; W = Withheld to avoid disclosure of individual company data. |
| Release Date: 6/1/2022 |
| Next Release Date: TBD |