|
Download Data (XLS File) |
|
||||||||
|
||||||||
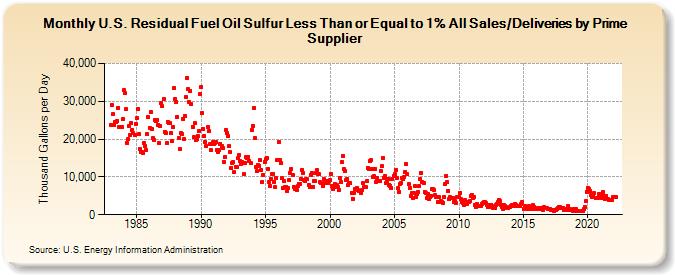
| U.S. Residual Fuel Oil Sulfur Less Than or Equal to 1% All Sales/Deliveries by Prime Supplier (Thousand Gallons per Day) | ||||||||
| Year | Jan | Feb | Mar | Apr | May | Jun | Jul | Aug | Sep | Oct | Nov | Dec |
|---|---|---|---|---|---|---|---|---|---|---|---|---|
| 1983 | 23,627.3 | 29,058.8 | 26,512.7 | 23,772.5 | 24,625.2 | 24,629.4 | 24,880.0 | 28,292.1 | 23,188.1 | 23,233.7 | 23,091.7 | 25,187.7 |
| 1984 | 32,912.8 | 32,243.2 | 27,833.2 | 18,973.1 | 19,945.3 | 23,434.2 | 21,108.8 | 24,326.6 | 22,472.9 | 21,496.0 | 21,168.3 | 24,061.5 |
| 1985 | 25,544.1 | 27,868.8 | 21,228.1 | 17,256.7 | 16,474.1 | 16,679.1 | 16,252.8 | 19,043.5 | 18,229.5 | 17,056.2 | 21,229.9 | 25,760.8 |
| 1986 | 23,066.6 | 27,130.1 | 22,703.7 | 20,287.7 | 19,864.5 | 25,004.4 | 24,756.0 | 25,153.9 | 23,809.2 | 19,031.7 | 23,435.7 | 29,517.1 |
| 1987 | 28,667.2 | 30,571.6 | 21,882.1 | 21,498.8 | 18,916.6 | 24,599.5 | 24,180.9 | 24,133.5 | 21,520.0 | 19,391.1 | 23,162.5 | 33,547.1 |
| 1988 | 30,660.5 | 29,816.5 | 25,975.7 | 20,230.7 | 17,266.3 | 21,557.5 | 21,291.4 | 25,413.8 | 19,946.6 | 26,128.5 | 31,039.0 | 36,143.0 |
| 1989 | 33,175.1 | 29,781.8 | 32,824.8 | 29,240.9 | 23,302.6 | 20,484.6 | 24,252.4 | 19,635.3 | 19,980.1 | 20,741.5 | 22,075.2 | 31,906.2 |
| 1990 | 33,900.0 | 26,917.4 | 22,630.9 | 20,846.2 | 19,284.5 | 18,111.7 | 23,132.5 | 22,032.6 | 18,640.4 | 17,056.2 | 18,741.8 | 19,221.8 |
| 1991 | 18,763.5 | 19,058.3 | 19,227.3 | 17,165.9 | 16,612.8 | 17,095.6 | 18,782.6 | 18,166.6 | 17,589.7 | 14,042.1 | 15,234.7 | 22,403.1 |
| 1992 | 21,505.1 | 20,727.3 | 18,076.8 | 16,645.4 | 12,475.9 | 13,767.9 | 13,834.3 | 11,172.6 | 12,750.8 | 12,638.7 | 14,886.8 | 15,686.0 |
| 1993 | 14,222.3 | 13,465.7 | 14,047.4 | 13,573.2 | 10,679.2 | 13,560.8 | 15,169.0 | 14,875.1 | 15,257.7 | 14,222.4 | 13,734.8 | 22,302.9 |
| 1994 | 23,504.5 | 28,303.7 | 20,252.7 | 12,589.9 | 11,603.4 | 13,098.6 | 12,988.9 | 14,419.6 | 11,835.4 | 8,758.4 | 10,517.5 | 13,949.2 |
| 1995 | 14,751.6 | 15,057.1 | 12,043.4 | 8,771.4 | 7,705.6 | 9,455.4 | 10,786.1 | 10,893.1 | 8,743.6 | 7,198.9 | 9,672.9 | 14,439.1 |
| 1996 | 19,255.2 | 14,352.8 | 13,589.5 | 9,591.6 | 7,093.1 | 8,852.7 | 7,254.9 | 7,342.1 | 6,235.5 | 7,153.6 | 9,064.4 | 11,136.8 |
| 1997 | 12,106.5 | 10,579.0 | 7,414.9 | 6,811.5 | 6,772.5 | 6,415.2 | 7,508.6 | 8,180.1 | 8,172.5 | 9,407.7 | 11,918.7 | 11,072.8 |
| 1998 | 9,253.0 | 8,959.8 | 9,541.4 | 9,364.3 | 7,848.4 | 7,426.3 | 10,537.8 | 11,143.6 | 7,398.1 | 8,973.0 | 8,878.0 | 11,099.1 |
| 1999 | 11,738.0 | 10,868.1 | 10,684.9 | 8,567.6 | 8,349.7 | 7,720.9 | 9,527.6 | 8,469.7 | 8,437.3 | 8,914.5 | 8,292.9 | 8,866.8 |
| 2000 | 9,092.4 | 10,657.4 | 7,547.7 | 6,874.6 | 7,305.5 | 8,030.3 | 7,824.8 | 7,393.1 | 6,454.6 | 9,827.5 | 8,548.6 | 13,937.5 |
| 2001 | 15,517.4 | 12,128.3 | 11,485.7 | 9,070.6 | 9,514.2 | 7,957.9 | 8,372.4 | 8,259.9 | 5,712.6 | 4,281.6 | 5,685.4 | 6,692.5 |
| 2002 | 6,735.5 | 7,109.1 | 6,421.0 | 6,353.4 | 6,398.7 | 5,811.7 | 6,592.6 | 8,309.1 | 7,304.7 | 7,371.9 | 8,807.5 | 12,372.2 |
| 2003 | 12,046.3 | 14,128.0 | 14,390.0 | 12,022.9 | 10,045.4 | 10,179.7 | 12,215.3 | 8,779.8 | 9,773.8 | 8,983.5 | 8,909.1 | 11,588.9 |
| 2004 | 12,882.1 | 15,076.2 | 9,822.6 | 10,227.1 | 8,322.2 | 9,042.8 | 9,559.0 | 7,883.5 | 7,681.5 | 7,092.2 | 9,538.0 | 10,277.1 |
| 2005 | 10,654.3 | 11,899.5 | 9,602.0 | 6,985.2 | 6,081.7 | 8,081.8 | 8,519.6 | 9,768.9 | 9,402.8 | 9,848.9 | 11,313.2 | 13,283.0 |
| 2006 | 10,658.5 | 7,996.6 | 7,046.9 | 5,056.5 | 5,639.9 | 4,528.8 | 5,722.6 | 7,497.9 | 4,583.9 | 5,398.3 | 6,054.5 | 7,501.7 |
| 2007 | 9,407.6 | 11,100.5 | 8,619.1 | 8,446.8 | 6,126.2 | 5,802.8 | 4,442.2 | 5,457.6 | 4,237.3 | 4,682.7 | 4,980.8 | 6,741.2 |
| 2008 | 6,827.4 | 6,490.3 | 5,145.1 | 4,677.6 | 3,384.5 | 4,581.4 | 3,335.1 | 3,703.6 | 3,466.8 | 3,222.3 | 4,675.4 | 8,048.1 |
| 2009 | 10,337.7 | 8,525.8 | 6,277.4 | 4,090.0 | 4,576.4 | 4,468.4 | 4,498.2 | 3,457.5 | 3,539.2 | 3,036.1 | 4,657.3 | 4,799.9 |
| 2010 | 4,737.8 | 5,841.4 | 4,048.0 | 3,276.7 | 3,133.8 | 2,613.5 | 3,781.8 | 2,947.3 | 3,309.2 | 3,282.9 | 3,626.9 | 4,907.0 |
| 2011 | 5,309.9 | 4,380.1 | 4,751.7 | 2,509.0 | 2,033.9 | 2,884.1 | 2,401.2 | 2,304.3 | 2,207.2 | 2,905.2 | 3,066.7 | 3,236.4 |
| 2012 | 3,402.9 | 3,008.3 | 2,613.1 | 1,978.2 | 2,053.1 | 2,543.4 | 2,632.0 | 2,378.7 | 1,866.8 | 1,812.1 | 2,517.2 | 2,919.9 |
| 2013 | 3,257.8 | 3,980.5 | 3,658.1 | 2,585.4 | 2,073.1 | 1,578.8 | 2,441.6 | 2,259.8 | 1,941.7 | 1,680.1 | 1,792.5 | 2,093.8 |
| 2014 | 2,310.8 | 2,622.5 | 2,382.5 | 2,201.6 | 2,950.0 | 2,634.8 | 2,427.1 | 2,330.9 | 2,387.5 | 2,191.3 | 2,751.5 | 3,355.6 |
| 2015 | 1,609.2 | 2,340.7 | 1,941.8 | 1,439.8 | 1,733.5 | 2,248.2 | 1,919.8 | 1,521.9 | 1,576.1 | 2,494.7 | 2,168.7 | 1,511.4 |
| 2016 | 1,543.5 | 1,760.0 | 1,455.3 | 1,667.6 | 1,733.4 | 1,405.6 | 1,379.2 | 1,920.9 | 1,658.5 | 1,781.6 | 1,651.9 | 1,525.1 |
| 2017 | 1,568.8 | 1,541.8 | 1,162.9 | 1,150.4 | 1,032.8 | 1,239.4 | 1,340.3 | 1,430.9 | 1,652.3 | 1,964.1 | 2,034.6 | 1,653.5 |
| 2018 | 1,706.3 | 1,815.5 | 1,250.1 | 1,192.4 | 1,387.5 | 2,176.4 | 1,172.1 | 1,385.0 | 1,263.5 | 1,346.5 | 1,009.8 | 1,527.4 |
| 2019 | 1,019.8 | 1,488.3 | 973.4 | 1,028.2 | W | W | 911.3 | 940.5 | 1,413.5 | 2,150.8 | 3,496.3 | 6,048.4 |
| 2020 | 7,113.5 | 6,803.3 | 6,239.4 | 5,140.8 | 4,697.1 | 5,139.1 | 5,659.4 | 4,452.0 | 4,471.9 | 4,479.7 | 5,382.0 | 5,385.4 |
| 2021 | 5,284.6 | 4,375.9 | 5,936.5 | 5,040.4 | 4,093.2 | 5,072.6 | 4,131.5 | 4,029.5 | 3,814.2 | 3,925.7 | 4,014.6 | 4,589.8 |
| 2022 | 4,779.4 | 4,730.8 | 4,568.4 | |||||||||
| - = No Data Reported; -- = Not Applicable; NA = Not Available; W = Withheld to avoid disclosure of individual company data. |
| Release Date: 5/19/2022 |
| Next Release Date: TBD |