|
Download Data (XLS File) |
|
||||||||
|
||||||||
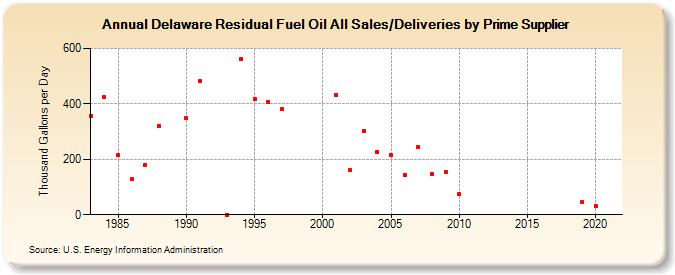
| Delaware Residual Fuel Oil All Sales/Deliveries by Prime Supplier (Thousand Gallons per Day) | ||||||||
| Decade | Year-0 | Year-1 | Year-2 | Year-3 | Year-4 | Year-5 | Year-6 | Year-7 | Year-8 | Year-9 |
|---|---|---|---|---|---|---|---|---|---|---|
| 1980's | 354.7 | 423.7 | 213.7 | 127.8 | 179.9 | 319.2 | W | |||
| 1990's | 348.3 | 481.0 | W | 0.0 | 560.0 | 417.8 | 407.8 | 380.2 | W | W |
| 2000's | W | 431.1 | 161.5 | 302.7 | 226.5 | 215.5 | 143.2 | 245.4 | 145.6 | 152.6 |
| 2010's | 74.6 | W | W | W | W | W | W | W | W | 46.7 |
| 2020's | 31.9 |
| - = No Data Reported; -- = Not Applicable; NA = Not Available; W = Withheld to avoid disclosure of individual company data. |
| Release Date: 6/1/2022 |
| Next Release Date: TBD |