|
Download Data (XLS File) |
|
||||||||
|
||||||||
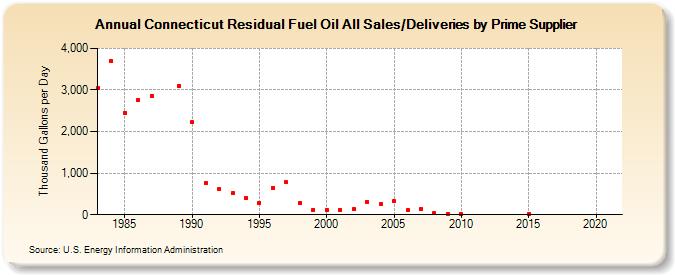
| Connecticut Residual Fuel Oil All Sales/Deliveries by Prime Supplier (Thousand Gallons per Day) | ||||||||
| Decade | Year-0 | Year-1 | Year-2 | Year-3 | Year-4 | Year-5 | Year-6 | Year-7 | Year-8 | Year-9 |
|---|---|---|---|---|---|---|---|---|---|---|
| 1980's | 3,053.9 | 3,696.2 | 2,449.9 | 2,750.8 | 2,865.1 | W | 3,107.3 | |||
| 1990's | 2,221.2 | 764.0 | 611.2 | 520.1 | 404.2 | 287.4 | 653.7 | 780.2 | 285.3 | 122.3 |
| 2000's | 117.0 | 118.1 | 128.0 | 309.9 | 250.5 | 319.8 | 102.1 | 138.7 | 35.1 | 17.6 |
| 2010's | 12.5 | W | W | W | W | 19.0 | W | W | W | W |
| 2020's | W |
| - = No Data Reported; -- = Not Applicable; NA = Not Available; W = Withheld to avoid disclosure of individual company data. |
| Release Date: 6/1/2022 |
| Next Release Date: TBD |