|
Download Data (XLS File) |
|
||||||||
|
||||||||
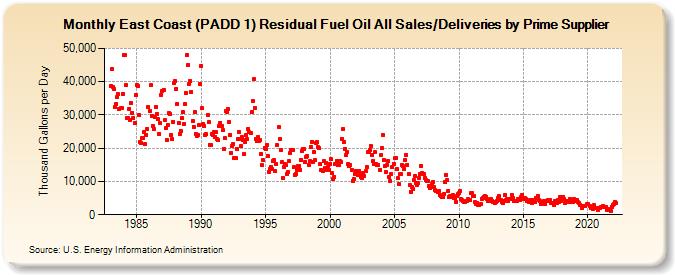
| East Coast (PADD 1) Residual Fuel Oil All Sales/Deliveries by Prime Supplier (Thousand Gallons per Day) | ||||||||
| Year | Jan | Feb | Mar | Apr | May | Jun | Jul | Aug | Sep | Oct | Nov | Dec |
|---|---|---|---|---|---|---|---|---|---|---|---|---|
| 1983 | 38,782.7 | 43,792.3 | 38,474.6 | 37,809.2 | 32,483.1 | 33,231.4 | 35,336.9 | 36,173.1 | 31,731.6 | 31,967.7 | 31,992.4 | 36,272.6 |
| 1984 | 47,866.2 | 48,047.7 | 38,996.1 | 29,008.9 | 29,211.3 | 31,854.9 | 28,355.5 | 33,567.7 | 30,582.0 | 29,180.7 | 27,498.5 | 35,866.4 |
| 1985 | 38,969.9 | 38,566.7 | 30,111.7 | 21,968.8 | 21,625.9 | 23,076.2 | 23,037.8 | 24,836.5 | 21,326.9 | 23,975.6 | 25,831.2 | 32,318.0 |
| 1986 | 31,188.5 | 38,889.8 | 29,761.0 | 26,810.6 | 25,747.1 | 29,232.3 | 32,471.8 | 30,303.7 | 28,768.6 | 24,371.4 | 27,449.5 | 36,056.5 |
| 1987 | 37,227.6 | 37,595.1 | 28,454.0 | 25,918.5 | 22,424.8 | 26,951.1 | 30,627.7 | 30,290.3 | 24,058.0 | 22,689.7 | 27,879.8 | 39,546.5 |
| 1988 | 40,148.8 | 37,925.1 | 33,367.5 | 27,684.2 | 24,261.5 | 25,235.6 | 29,060.8 | 30,784.5 | 27,363.0 | 33,202.6 | 36,596.7 | 47,952.5 |
| 1989 | 45,080.7 | 39,409.5 | 40,250.8 | 36,881.0 | 28,192.6 | 26,480.2 | 30,859.4 | 24,325.3 | 23,782.9 | 23,933.4 | 26,869.3 | 39,381.0 |
| 1990 | 44,844.9 | 31,975.4 | 27,333.0 | 26,715.6 | 24,036.8 | 24,125.3 | 29,955.5 | 27,778.2 | 21,090.9 | 21,008.7 | 24,383.4 | 23,952.9 |
| 1991 | 24,780.0 | 23,492.8 | 24,908.0 | 22,685.5 | 22,495.3 | 26,581.6 | 27,696.8 | 26,706.4 | 25,385.3 | 19,740.3 | 23,000.4 | 31,080.6 |
| 1992 | 30,996.8 | 31,725.7 | 27,879.3 | 24,022.4 | 18,615.5 | 20,507.1 | 21,278.0 | 16,904.8 | 17,158.3 | 19,866.4 | 22,710.8 | 24,874.9 |
| 1993 | 22,888.4 | 20,655.6 | 23,421.3 | 22,596.3 | 18,159.3 | 21,883.1 | 24,011.8 | 22,701.3 | 25,774.4 | 24,798.3 | 24,421.1 | 30,861.6 |
| 1994 | 34,217.2 | 40,712.2 | 32,112.1 | 22,818.8 | 22,070.2 | 23,366.8 | 22,071.8 | 22,410.0 | 18,345.5 | 14,862.8 | 16,303.3 | 20,078.8 |
| 1995 | 19,870.1 | 21,053.9 | 17,705.8 | 12,934.4 | 13,858.1 | 14,487.3 | 13,667.9 | 16,236.4 | 16,351.1 | 13,195.6 | 15,200.5 | 20,825.0 |
| 1996 | 26,431.5 | 22,634.5 | 19,532.4 | 15,780.0 | 11,101.0 | 14,371.6 | 15,172.4 | 14,837.7 | 12,311.7 | 12,763.7 | 16,060.8 | 18,408.5 |
| 1997 | 19,524.3 | 19,457.8 | 14,197.7 | 12,077.1 | 12,308.5 | 13,568.7 | 14,624.7 | 14,773.4 | 13,566.4 | 16,523.2 | 19,297.8 | 19,668.3 |
| 1998 | 19,720.5 | 15,908.6 | 17,283.8 | 17,564.7 | 15,050.3 | 16,139.9 | 20,499.8 | 22,003.3 | 15,854.0 | 18,917.0 | 16,327.5 | 21,535.1 |
| 1999 | 21,737.3 | 20,275.5 | 19,964.0 | 15,179.8 | 13,390.3 | 13,200.0 | 16,071.1 | 13,998.4 | 15,483.3 | 13,413.1 | 14,212.5 | 13,508.7 |
| 2000 | 15,225.6 | 16,637.3 | 12,446.5 | 10,738.1 | 11,406.8 | 15,134.5 | 16,244.8 | 14,933.0 | 14,881.9 | 16,013.6 | 15,903.1 | 22,889.8 |
| 2001 | 25,799.6 | 21,864.2 | 19,831.9 | 17,911.9 | 18,882.7 | 15,230.2 | 14,577.3 | 14,927.7 | 13,541.8 | 10,200.3 | 10,684.8 | 12,321.7 |
| 2002 | 13,182.4 | 12,888.6 | 11,853.6 | 13,257.5 | 12,062.5 | 11,317.7 | 11,033.9 | 12,435.4 | 11,601.6 | 13,034.0 | 14,337.9 | 18,762.0 |
| 2003 | 18,857.7 | 19,557.0 | 20,622.8 | 17,829.3 | 16,250.4 | 15,238.9 | 18,717.9 | 15,272.9 | 14,898.5 | 14,932.2 | 13,562.9 | 17,821.3 |
| 2004 | 20,103.4 | 24,058.4 | 16,461.1 | 14,627.7 | 12,903.6 | 14,890.6 | 16,194.8 | 11,435.3 | 10,274.4 | 12,353.1 | 14,394.1 | 15,328.7 |
| 2005 | 16,961.4 | 17,144.4 | 13,753.5 | 10,914.1 | 9,125.7 | 12,101.7 | 12,250.8 | 14,927.4 | 14,528.7 | 13,727.2 | 16,488.8 | 17,993.7 |
| 2006 | 15,070.3 | 12,371.9 | 8,865.5 | 6,918.3 | 8,376.9 | 7,838.8 | 10,414.8 | 11,601.2 | 9,618.3 | 8,820.9 | 9,522.3 | 11,080.9 |
| 2007 | 12,172.8 | 14,659.3 | 12,603.1 | 12,168.4 | 11,139.2 | 10,488.8 | 10,079.9 | 10,168.3 | 8,574.7 | 7,903.6 | 8,553.2 | 9,263.8 |
| 2008 | 9,969.9 | 8,184.0 | 7,332.0 | 7,064.5 | 6,736.0 | 7,103.0 | 5,806.8 | 5,481.8 | 5,267.9 | 5,267.7 | 6,369.8 | 9,809.7 |
| 2009 | 12,071.0 | 10,408.1 | 7,258.9 | 5,414.6 | 5,629.5 | 5,286.7 | 5,810.0 | 4,901.6 | 4,875.4 | 3,909.4 | 5,479.1 | 6,189.8 |
| 2010 | 6,388.9 | 7,179.7 | 4,630.2 | 4,340.7 | 4,144.6 | 3,811.1 | 3,958.2 | 4,229.0 | 4,622.0 | 4,282.6 | 4,481.7 | 6,402.1 |
| 2011 | 6,582.5 | 5,547.9 | 5,502.7 | 3,722.0 | 3,282.6 | 3,530.0 | 2,772.7 | 2,820.6 | 3,139.5 | 4,864.4 | 4,997.7 | 5,453.8 |
| 2012 | 5,510.1 | 5,398.8 | 4,833.2 | 4,162.5 | 4,174.7 | 4,262.7 | 4,694.0 | 4,242.4 | 3,728.4 | 3,477.8 | 3,961.9 | 4,120.8 |
| 2013 | 4,971.5 | 5,581.6 | 4,569.4 | 4,369.7 | 3,847.2 | 3,383.7 | 4,162.3 | 5,945.5 | 4,301.2 | 4,842.2 | 4,225.7 | 4,597.9 |
| 2014 | 4,781.3 | 6,008.6 | 5,107.0 | 3,983.9 | 4,258.9 | 4,087.0 | 4,152.1 | 4,730.2 | 4,524.6 | 4,500.2 | 5,382.9 | 6,017.6 |
| 2015 | 4,680.5 | 4,906.0 | 4,619.4 | 4,140.5 | 3,988.3 | 3,842.7 | 4,284.5 | 3,809.6 | 3,671.4 | 4,522.7 | 4,165.0 | 3,714.4 |
| 2016 | 4,882.9 | 5,706.2 | 4,496.2 | 4,042.1 | 3,333.1 | 3,423.0 | 3,390.7 | 4,054.6 | 3,100.6 | 4,046.3 | 4,226.5 | 4,475.2 |
| 2017 | 4,228.2 | 4,479.5 | 3,457.2 | 3,459.4 | 3,069.1 | 4,034.8 | 3,791.5 | 3,513.9 | 4,424.0 | 3,780.0 | 5,372.7 | 4,143.0 |
| 2018 | 5,258.6 | 5,375.6 | 4,688.9 | 3,643.2 | 4,079.2 | 4,244.3 | 3,759.6 | 4,670.5 | 3,719.3 | 4,016.4 | 3,772.1 | 4,841.2 |
| 2019 | 4,230.8 | 4,263.1 | 4,351.0 | 3,679.9 | 3,398.0 | 3,032.1 | 2,143.8 | 2,685.5 | W | 2,764.8 | W | 3,282.5 |
| 2020 | 3,175.8 | W | 2,699.2 | 2,076.0 | 2,066.7 | 1,685.0 | 2,815.2 | 2,126.7 | 1,881.5 | 1,484.4 | 2,100.9 | 2,045.4 |
| 2021 | 2,393.7 | W | 2,750.2 | 2,318.0 | 2,261.9 | 2,359.4 | 1,489.6 | 1,680.5 | 1,425.9 | 1,217.0 | 2,435.9 | 2,933.7 |
| 2022 | 3,255.8 | 3,855.2 | 3,465.5 | |||||||||
| - = No Data Reported; -- = Not Applicable; NA = Not Available; W = Withheld to avoid disclosure of individual company data. |
| Release Date: 5/19/2022 |
| Next Release Date: TBD |