|
Download Data (XLS File) |
|
||||||||
|
||||||||
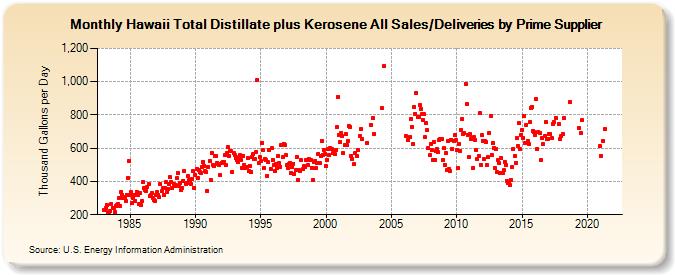
| Hawaii Total Distillate plus Kerosene All Sales/Deliveries by Prime Supplier (Thousand Gallons per Day) | ||||||||
| Year | Jan | Feb | Mar | Apr | May | Jun | Jul | Aug | Sep | Oct | Nov | Dec |
|---|---|---|---|---|---|---|---|---|---|---|---|---|
| 1983 | 226.8 | 226.0 | 242.2 | 255.5 | 210.6 | 215.8 | 221.2 | 265.9 | 242.4 | 241.5 | 215.7 | 252.1 |
| 1984 | 260.8 | 266.5 | 301.4 | 251.9 | 338.4 | 320.2 | 299.6 | 308.2 | 280.5 | 321.4 | 422.9 | 525.8 |
| 1985 | 319.2 | 336.5 | 269.1 | 297.6 | 315.6 | 282.6 | 338.5 | 320.4 | 263.6 | 329.6 | 257.0 | 285.0 |
| 1986 | 395.8 | 359.9 | 345.7 | 343.5 | 369.5 | 385.9 | 309.7 | 319.2 | 330.6 | 298.2 | 288.7 | 284.9 |
| 1987 | 318.7 | 335.6 | 319.2 | 303.9 | 385.3 | 340.4 | 358.8 | 320.5 | 361.3 | 394.2 | 338.8 | 353.6 |
| 1988 | 385.0 | 424.8 | 397.0 | 360.4 | 386.9 | 371.6 | 376.6 | 418.8 | 450.4 | 370.4 | 392.9 | 346.4 |
| 1989 | 360.6 | 404.9 | 465.2 | 386.8 | 388.1 | 431.3 | 407.9 | 405.8 | 385.3 | 417.3 | 460.7 | 361.8 |
| 1990 | 437.5 | 475.0 | 419.9 | 467.1 | 457.1 | 453.5 | 484.9 | 519.5 | 494.7 | 460.7 | 457.5 | 343.5 |
| 1991 | 487.0 | 523.0 | 411.6 | 572.8 | 500.4 | 493.8 | 553.5 | 554.2 | 513.4 | 506.5 | 499.4 | 436.9 |
| 1992 | 509.8 | 518.2 | 516.2 | 557.6 | 497.9 | 573.0 | 605.3 | 553.3 | 584.6 | 582.0 | 455.4 | 568.8 |
| 1993 | 556.6 | 540.3 | 527.2 | 516.1 | 546.5 | 558.1 | 530.2 | 483.2 | 555.7 | 499.2 | 482.9 | 485.0 |
| 1994 | 539.8 | 465.4 | 493.8 | 457.7 | 544.5 | 562.2 | 534.5 | 535.6 | 579.8 | 1,011.6 | 512.3 | 547.1 |
| 1995 | 520.5 | 633.6 | 587.5 | 480.7 | 537.2 | 528.6 | 435.1 | 514.9 | 587.0 | 476.8 | 599.5 | 530.1 |
| 1996 | 496.4 | 464.1 | 505.7 | 482.8 | 555.8 | 508.1 | 489.3 | 621.9 | 544.8 | 625.7 | 618.0 | 556.4 |
| 1997 | 498.6 | 479.6 | 502.8 | 512.6 | 453.3 | 488.5 | 507.8 | 446.4 | 466.7 | 547.7 | 410.5 | 465.9 |
| 1998 | 461.6 | 527.0 | W | 472.9 | 490.1 | 484.4 | 527.6 | 499.9 | 537.6 | 530.7 | 526.9 | 483.4 |
| 1999 | 409.5 | 516.1 | 523.6 | 478.9 | 508.8 | 567.0 | 509.6 | 552.2 | 645.7 | 561.9 | 588.4 | 564.6 |
| 2000 | 491.9 | 530.7 | 594.7 | 557.9 | 600.2 | 597.1 | 570.6 | 581.2 | 565.7 | 586.2 | 727.7 | 909.5 |
| 2001 | 681.2 | 636.0 | 691.4 | 673.0 | 570.2 | 620.1 | 685.2 | 621.2 | 640.3 | 734.3 | 730.3 | 556.0 |
| 2002 | 537.5 | W | 502.4 | 571.1 | 555.9 | 591.0 | W | 675.2 | 715.5 | 657.6 | NA | NA |
| 2003 | W | NA | 633.2 | W | NA | 742.0 | W | 779.8 | 687.6 | W | W | W |
| 2004 | W | W | W | 839.8 | W | 1,093.3 | W | W | W | W | W | W |
| 2005 | W | W | W | W | W | W | W | W | W | W | W | W |
| 2006 | W | 674.4 | NA | 646.3 | W | 668.4 | 777.6 | 727.7 | 625.7 | 848.1 | 808.4 | 933.4 |
| 2007 | 788.5 | 786.0 | 859.9 | 837.0 | 804.2 | 770.6 | 805.4 | 665.3 | 748.6 | 708.8 | 599.7 | 556.4 |
| 2008 | 628.1 | 592.0 | 529.4 | 639.9 | 530.5 | 583.8 | 596.0 | 575.1 | 647.7 | 656.0 | 656.5 | 529.8 |
| 2009 | 599.1 | 501.4 | 571.1 | 466.3 | 642.9 | 477.8 | 462.3 | 651.7 | 595.4 | 643.8 | 676.4 | 648.8 |
| 2010 | 590.7 | 481.8 | 626.8 | 584.0 | 711.2 | 774.2 | 686.6 | 690.3 | 987.6 | 864.7 | 681.3 | 545.7 |
| 2011 | 684.9 | 655.0 | 664.1 | 481.4 | 664.8 | 651.9 | 588.8 | 533.9 | 555.5 | 810.3 | 501.9 | 678.6 |
| 2012 | 645.8 | 534.8 | 640.7 | 636.3 | 497.3 | 545.0 | 693.2 | 795.6 | 559.4 | 630.3 | 602.7 | 478.6 |
| 2013 | 597.2 | 454.1 | 526.3 | 510.9 | 450.6 | 539.4 | 450.4 | 467.1 | 519.8 | 497.5 | 403.8 | 389.9 |
| 2014 | 391.0 | 377.1 | 407.4 | 487.4 | 597.4 | 554.2 | 511.1 | 662.9 | 614.1 | 748.8 | 595.3 | 681.4 |
| 2015 | 711.8 | 662.4 | 795.8 | 633.3 | 741.1 | 642.4 | 626.6 | 757.3 | 844.4 | 846.4 | 705.8 | 697.2 |
| 2016 | 678.3 | 893.3 | 594.0 | 694.7 | 691.5 | 526.9 | 662.7 | 624.7 | W | 671.1 | 758.5 | 654.3 |
| 2017 | 658.0 | 685.7 | 684.9 | 658.5 | 747.9 | 758.4 | W | 783.4 | W | W | 743.6 | 655.4 |
| 2018 | 671.0 | 685.6 | 778.8 | W | W | W | W | W | 876.4 | W | W | W |
| 2019 | W | W | W | W | 723.0 | W | 691.3 | 769.2 | W | W | W | W |
| 2020 | W | W | W | W | W | W | W | W | W | W | W | 611.5 |
| 2021 | 554.6 | W | 643.3 | W | 712.5 | W | W | W | W | W | W | W |
| 2022 | W | W | W | |||||||||
| - = No Data Reported; -- = Not Applicable; NA = Not Available; W = Withheld to avoid disclosure of individual company data. |
| Release Date: 5/19/2022 |
| Next Release Date: TBD |