|
Download Data (XLS File) |
|
||||||||
|
||||||||
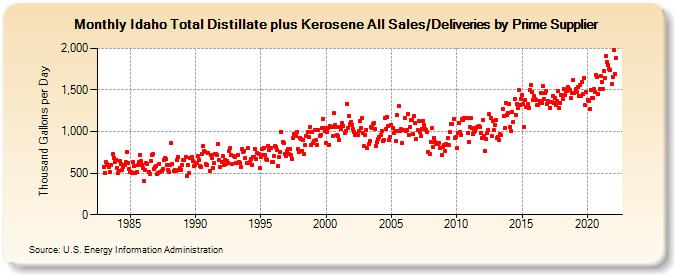
| Idaho Total Distillate plus Kerosene All Sales/Deliveries by Prime Supplier (Thousand Gallons per Day) | ||||||||
| Year | Jan | Feb | Mar | Apr | May | Jun | Jul | Aug | Sep | Oct | Nov | Dec |
|---|---|---|---|---|---|---|---|---|---|---|---|---|
| 1983 | 570.9 | 507.6 | 633.3 | 607.4 | 592.6 | 577.7 | 509.5 | 594.9 | 727.5 | 686.5 | 633.4 | 660.4 |
| 1984 | 566.6 | 503.8 | 526.4 | 641.8 | 604.4 | 537.9 | 577.9 | 592.2 | 634.3 | 758.8 | 616.1 | 552.2 |
| 1985 | 518.1 | 508.6 | 498.5 | 635.4 | 588.1 | 500.2 | 515.0 | 592.3 | 630.7 | 720.8 | 639.9 | 602.9 |
| 1986 | 562.9 | 401.4 | 541.5 | 617.4 | 608.7 | 519.2 | 490.5 | 640.2 | 721.7 | 724.4 | 554.8 | 578.1 |
| 1987 | 588.5 | 488.3 | 497.9 | 613.8 | 518.7 | 530.3 | 549.7 | 659.9 | 676.2 | 665.2 | 600.3 | 542.8 |
| 1988 | 516.0 | 592.4 | 865.2 | 613.5 | 529.9 | 533.3 | 529.2 | 654.6 | 696.0 | 536.9 | 562.1 | 542.4 |
| 1989 | 597.2 | 652.5 | 657.4 | 696.6 | 463.3 | 593.1 | 498.9 | 687.4 | 678.3 | 694.1 | 642.0 | 582.9 |
| 1990 | 594.7 | 626.7 | 706.8 | 654.4 | 587.2 | 572.5 | 727.3 | 822.4 | 764.4 | 758.1 | 605.8 | 600.0 |
| 1991 | 746.3 | 524.9 | 713.6 | 676.1 | 564.6 | 621.2 | 726.0 | 725.9 | 716.1 | 848.5 | 655.2 | 574.2 |
| 1992 | 634.2 | 704.6 | 601.2 | 652.6 | 605.8 | 648.2 | 622.0 | 770.5 | 803.7 | 715.0 | 610.2 | 703.3 |
| 1993 | 700.0 | 624.2 | 620.1 | 721.1 | 635.5 | 621.0 | 575.0 | 786.2 | 758.7 | 764.4 | 681.5 | 619.5 |
| 1994 | 808.0 | 623.8 | 639.8 | 664.5 | 602.8 | 695.8 | 698.6 | 794.5 | 673.2 | 738.9 | 735.5 | 558.6 |
| 1995 | 690.4 | 784.5 | 713.1 | 799.2 | 714.1 | 671.2 | 655.4 | 828.8 | 772.3 | 805.6 | 630.7 | 637.4 |
| 1996 | 710.2 | 824.7 | 814.3 | 779.5 | 583.3 | 695.5 | 755.3 | 996.9 | 875.5 | 861.1 | 730.8 | 703.4 |
| 1997 | 761.9 | 789.2 | 732.7 | 788.6 | 716.1 | 665.0 | 919.9 | 972.4 | 943.8 | 999.9 | 790.3 | 752.7 |
| 1998 | 917.9 | 914.3 | 771.3 | 903.2 | 729.2 | 840.7 | 946.6 | 991.8 | 936.1 | 1,054.4 | 839.2 | 999.4 |
| 1999 | 859.8 | 890.7 | 1,017.0 | 896.3 | 844.3 | 1,021.0 | 950.5 | 963.8 | 1,048.5 | 1,148.5 | 1,045.4 | 1,000.8 |
| 2000 | 867.0 | 993.6 | 1,038.7 | 844.1 | 1,069.1 | 1,058.3 | 949.2 | 1,220.6 | 1,073.8 | 1,053.5 | 959.5 | 943.0 |
| 2001 | 902.2 | 1,049.6 | 1,027.7 | 1,099.8 | 1,071.6 | 986.8 | 1,005.6 | 1,337.1 | 1,046.6 | 1,187.6 | 1,093.4 | 1,118.3 |
| 2002 | 1,084.6 | 1,028.6 | 998.6 | 960.2 | 975.9 | 960.9 | 1,007.6 | 1,122.3 | 1,041.7 | 1,157.3 | 982.4 | 820.6 |
| 2003 | 962.4 | 1,024.1 | 796.7 | 846.1 | 881.6 | 1,056.1 | 1,044.2 | 1,087.7 | 1,104.0 | 1,035.6 | 826.3 | 874.0 |
| 2004 | 915.5 | 930.6 | 962.4 | 1,012.0 | 882.3 | 895.0 | 1,159.4 | 1,029.8 | 1,171.0 | 1,063.9 | 899.2 | 933.9 |
| 2005 | 1,077.6 | 1,040.1 | 977.9 | 1,002.6 | 884.9 | 1,196.2 | 1,003.3 | 1,302.4 | 1,009.5 | 1,025.3 | 859.1 | 1,013.1 |
| 2006 | 1,162.2 | 1,006.0 | 1,013.6 | 1,212.8 | 961.3 | 1,052.1 | 1,139.8 | 1,143.8 | 967.4 | 1,186.5 | 1,098.2 | 908.5 |
| 2007 | 1,016.8 | 1,127.8 | 998.5 | 949.2 | 1,032.7 | 1,130.9 | 1,081.6 | 1,035.6 | 1,021.4 | 994.3 | 748.2 | 729.9 |
| 2008 | 876.5 | 1,036.8 | 815.9 | 924.1 | 872.7 | 860.9 | 846.5 | 856.1 | 866.0 | 799.3 | 716.8 | 813.7 |
| 2009 | 839.3 | 761.8 | 846.2 | 837.6 | 928.4 | 834.6 | 993.5 | 1,087.9 | 1,093.2 | 1,156.3 | 921.8 | 940.3 |
| 2010 | 801.1 | 978.0 | 1,101.0 | 1,000.4 | 961.5 | 1,149.8 | 1,141.4 | 1,163.2 | 1,160.9 | 1,166.9 | 987.4 | 871.7 |
| 2011 | 1,053.5 | 1,158.2 | 1,037.5 | 976.3 | 999.5 | 1,011.7 | 1,039.7 | 1,056.8 | 1,068.0 | 1,053.5 | 978.3 | 920.2 |
| 2012 | 1,140.7 | 951.7 | 764.8 | 909.5 | 985.5 | 1,020.2 | 1,206.8 | 1,165.6 | 941.4 | 1,126.5 | 1,016.0 | 1,083.4 |
| 2013 | 1,142.7 | 923.1 | 939.0 | 893.7 | 966.5 | 958.5 | 1,266.2 | 1,187.1 | 1,041.1 | 1,343.5 | 1,202.1 | 1,228.4 |
| 2014 | 1,336.7 | 1,060.7 | 1,008.5 | 1,232.0 | 1,116.1 | 1,392.1 | 1,200.1 | 1,335.8 | 1,288.7 | 1,502.9 | 1,324.3 | 1,392.2 |
| 2015 | 1,436.5 | 1,331.1 | 1,052.0 | 1,383.5 | 1,291.8 | 1,328.1 | 1,289.2 | 1,494.0 | 1,556.0 | 1,474.7 | 1,382.4 | 1,431.6 |
| 2016 | 1,388.3 | 1,377.0 | 1,318.8 | 1,323.2 | 1,371.9 | 1,463.2 | 1,342.0 | 1,542.5 | 1,391.8 | 1,458.9 | 1,485.1 | 1,327.7 |
| 2017 | 1,363.5 | 1,357.1 | 1,287.4 | 1,352.7 | 1,430.7 | 1,341.5 | 1,403.6 | 1,323.7 | 1,369.5 | 1,493.5 | 1,285.4 | 1,338.1 |
| 2018 | 1,441.0 | 1,394.4 | 1,516.6 | 1,439.9 | 1,491.6 | 1,484.1 | 1,530.4 | 1,506.9 | 1,498.6 | 1,403.3 | 1,461.3 | 1,615.2 |
| 2019 | 1,467.1 | 1,507.6 | 1,478.3 | 1,530.7 | 1,432.0 | 1,557.4 | 1,428.4 | 1,598.5 | 1,448.8 | 1,645.0 | 1,315.7 | 1,475.3 |
| 2020 | 1,383.3 | 1,365.8 | 1,274.6 | 1,505.6 | 1,400.8 | 1,399.1 | 1,508.8 | 1,480.0 | 1,680.4 | 1,653.1 | 1,450.6 | 1,516.9 |
| 2021 | 1,668.0 | 1,599.8 | 1,513.1 | 1,727.8 | 1,643.8 | 1,908.4 | 1,833.4 | 1,802.0 | 1,747.4 | 1,740.5 | 1,572.0 | 1,657.9 |
| 2022 | 1,980.1 | 1,693.3 | 1,888.8 | |||||||||
| - = No Data Reported; -- = Not Applicable; NA = Not Available; W = Withheld to avoid disclosure of individual company data. |
| Release Date: 5/19/2022 |
| Next Release Date: TBD |