|
Download Data (XLS File) |
|
||||||||
|
||||||||
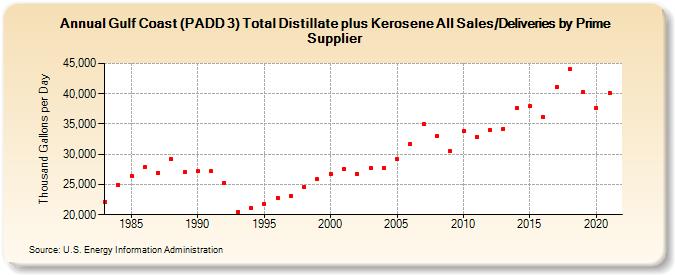
| Gulf Coast (PADD 3) Total Distillate plus Kerosene All Sales/Deliveries by Prime Supplier (Thousand Gallons per Day) | ||||||||
| Decade | Year-0 | Year-1 | Year-2 | Year-3 | Year-4 | Year-5 | Year-6 | Year-7 | Year-8 | Year-9 |
|---|---|---|---|---|---|---|---|---|---|---|
| 1980's | 22,173.5 | 24,960.0 | 26,439.4 | 27,863.5 | 26,953.8 | 29,221.7 | 27,047.1 | |||
| 1990's | 27,171.4 | 27,158.9 | 25,297.1 | 20,508.7 | 21,125.4 | 21,813.5 | 22,814.9 | 23,172.3 | 24,655.4 | 25,855.1 |
| 2000's | 26,775.0 | 27,521.8 | 26,811.5 | 27,762.0 | 27,737.3 | 29,144.4 | 31,707.8 | 34,918.5 | 32,946.0 | 30,475.8 |
| 2010's | 33,791.8 | 32,895.9 | 34,063.4 | 34,226.0 | 37,633.0 | 37,962.7 | 36,134.7 | 41,114.2 | 44,017.8 | 40,264.5 |
| 2020's | 37,594.4 |
| - = No Data Reported; -- = Not Applicable; NA = Not Available; W = Withheld to avoid disclosure of individual company data. |
| Release Date: 6/1/2022 |
| Next Release Date: TBD |