|
Download Data (XLS File) |
|
||||||||
|
||||||||
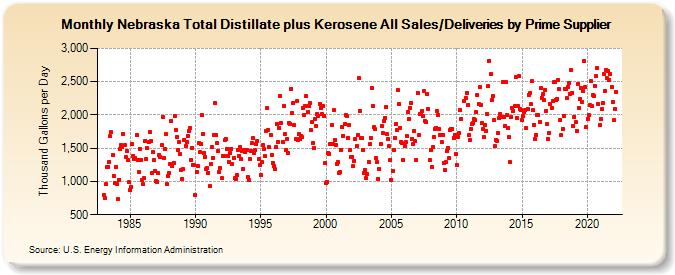
| Nebraska Total Distillate plus Kerosene All Sales/Deliveries by Prime Supplier (Thousand Gallons per Day) | ||||||||
| Year | Jan | Feb | Mar | Apr | May | Jun | Jul | Aug | Sep | Oct | Nov | Dec |
|---|---|---|---|---|---|---|---|---|---|---|---|---|
| 1983 | 789.2 | 744.3 | 961.1 | 1,224.1 | 1,222.2 | 1,293.4 | 1,678.4 | 1,737.4 | 1,392.0 | 1,086.9 | 974.2 | 1,218.7 |
| 1984 | 963.4 | 730.8 | 1,029.2 | 1,488.1 | 1,547.7 | 1,516.9 | 1,711.9 | 1,541.5 | 1,371.2 | 1,450.8 | 1,314.9 | 985.3 |
| 1985 | 866.4 | 922.2 | 1,556.0 | 1,386.4 | 1,342.0 | 1,355.5 | 1,698.4 | 1,328.7 | 1,135.6 | 1,494.1 | 1,329.8 | 1,023.3 |
| 1986 | 954.9 | 1,046.3 | 1,602.1 | 1,332.1 | 1,497.6 | 1,596.3 | 1,743.6 | 1,603.4 | 1,131.1 | 1,438.1 | 1,320.2 | 1,158.1 |
| 1987 | 999.8 | 994.7 | 1,121.9 | 1,392.9 | 1,367.3 | 1,541.1 | 1,963.3 | 1,358.3 | 1,490.9 | 1,709.2 | 956.8 | 1,075.7 |
| 1988 | 1,120.6 | 1,265.5 | 1,910.7 | 1,225.7 | 1,281.7 | 1,989.6 | 1,780.4 | 1,665.5 | 1,469.0 | 1,591.5 | 1,407.0 | 1,176.7 |
| 1989 | 1,035.1 | 1,181.1 | 1,623.8 | 1,526.9 | 1,589.3 | 1,683.4 | 1,756.6 | 1,805.0 | 1,325.9 | 1,501.8 | 1,243.1 | 1,248.5 |
| 1990 | 792.0 | 1,143.5 | 1,236.0 | 1,579.7 | 1,438.8 | 1,568.6 | 2,002.4 | 1,714.6 | 1,432.5 | 1,371.4 | 1,189.2 | 1,201.5 |
| 1991 | 1,131.5 | 931.1 | 1,258.7 | 1,515.4 | 1,354.1 | 1,696.2 | 2,177.1 | 1,693.0 | 1,573.0 | 1,464.4 | 1,134.9 | 1,199.8 |
| 1992 | 1,047.5 | 1,381.9 | 1,380.1 | 1,618.9 | 1,641.9 | 1,491.8 | 1,382.6 | 1,292.7 | 1,428.4 | 1,492.0 | 1,262.7 | 1,354.5 |
| 1993 | 1,046.7 | 1,038.9 | 1,090.8 | 1,470.3 | 1,386.6 | 1,514.0 | 1,337.4 | 1,462.9 | 1,192.4 | 1,474.5 | 1,441.1 | 1,475.4 |
| 1994 | 1,073.6 | 1,017.0 | 1,330.6 | 1,462.1 | 1,576.5 | 1,656.3 | 1,426.0 | 1,471.4 | 1,558.6 | 1,608.7 | 1,338.6 | 1,243.5 |
| 1995 | 1,094.7 | 1,292.3 | 1,540.4 | 1,492.7 | 1,379.8 | 1,754.6 | 2,100.1 | 1,774.1 | 1,513.1 | 1,700.8 | 1,402.7 | 1,283.8 |
| 1996 | 1,232.0 | 1,180.6 | 1,514.4 | 1,867.3 | 1,597.5 | 1,808.3 | 2,280.8 | 1,885.2 | 1,594.6 | 2,141.3 | 1,710.9 | 1,473.0 |
| 1997 | 1,634.1 | 1,431.2 | 1,882.3 | 1,871.0 | 2,390.8 | 2,029.9 | 2,185.1 | 1,848.6 | 1,635.5 | 2,203.3 | 1,620.0 | 1,708.0 |
| 1998 | 1,644.3 | 1,683.9 | 1,666.4 | 2,099.1 | 2,001.7 | 2,138.8 | 2,280.0 | 2,048.3 | 2,138.2 | 2,171.9 | 1,769.6 | 1,887.9 |
| 1999 | 1,579.9 | 1,501.0 | 1,945.1 | 1,832.7 | 2,007.5 | 1,981.7 | 2,168.8 | 2,107.3 | 2,019.5 | 2,130.9 | 1,977.7 | 1,273.2 |
| 2000 | 974.5 | 997.8 | 1,432.7 | 1,418.6 | 1,566.9 | 1,850.2 | 1,558.8 | 2,068.4 | 1,620.1 | 1,552.6 | 1,264.7 | 1,294.4 |
| 2001 | 1,119.7 | 1,139.7 | 1,478.2 | 1,812.4 | 1,687.3 | 1,865.8 | 1,998.1 | 1,980.0 | 1,655.0 | 1,850.3 | 1,470.9 | 1,366.9 |
| 2002 | 1,371.8 | 1,226.4 | 1,303.7 | 1,636.4 | 1,531.1 | 1,701.1 | 2,551.4 | 2,065.2 | 1,648.9 | 1,647.0 | 1,470.0 | 1,131.6 |
| 2003 | 1,177.9 | 1,046.2 | 1,112.5 | 1,294.5 | 1,560.8 | 1,658.7 | 2,409.1 | 2,135.2 | 1,813.4 | 1,782.8 | 1,350.9 | 1,285.2 |
| 2004 | 1,038.2 | 1,180.6 | 1,557.7 | 1,840.3 | 1,724.0 | 1,911.9 | 1,959.3 | 2,116.1 | 1,710.2 | 1,645.5 | 1,527.9 | 1,328.4 |
| 2005 | 1,020.3 | 1,155.6 | 1,477.8 | 1,660.4 | 1,864.3 | 1,775.9 | 2,375.9 | 2,166.8 | 1,807.6 | 1,594.7 | 1,577.1 | 1,318.6 |
| 2006 | 1,533.4 | 1,590.3 | 1,681.0 | 2,041.6 | 1,941.9 | 2,110.6 | 2,181.9 | 1,644.7 | 1,558.5 | 1,756.4 | 1,601.5 | 1,329.1 |
| 2007 | 2,335.6 | 1,694.3 | 2,007.4 | 2,012.2 | 2,064.8 | 1,983.0 | 2,359.4 | 1,903.5 | 1,893.1 | 2,309.1 | 2,090.5 | 1,324.3 |
| 2008 | 1,472.5 | 1,219.5 | 1,513.7 | 1,673.6 | 1,788.5 | 1,805.1 | 2,053.0 | 2,001.5 | 1,789.5 | 1,700.5 | 1,592.3 | 1,700.9 |
| 2009 | 1,277.9 | 1,171.7 | 1,290.7 | 1,456.7 | 1,498.6 | 1,356.3 | 1,768.1 | 1,788.1 | 1,788.8 | 1,660.3 | 1,698.3 | 1,417.5 |
| 2010 | 1,243.6 | 1,675.5 | 1,723.9 | 2,080.1 | 1,940.7 | NA | NA | 2,215.1 | 2,260.1 | 2,334.0 | 2,147.4 | 1,694.1 |
| 2011 | 1,622.7 | 1,788.9 | 1,860.7 | 1,877.9 | 1,935.6 | 1,924.6 | 2,039.6 | 2,295.9 | 2,157.2 | 2,421.1 | 2,150.6 | 1,877.9 |
| 2012 | 1,790.6 | 1,665.7 | 1,841.3 | 1,762.1 | 2,013.8 | 2,430.1 | 2,816.6 | 2,609.4 | 2,217.4 | 2,278.6 | 1,927.3 | 1,526.4 |
| 2013 | 1,622.9 | 1,614.8 | 1,725.1 | 1,948.9 | 2,016.0 | 1,972.7 | 2,494.2 | 1,968.2 | 1,830.6 | 2,494.8 | 1,992.8 | 1,808.7 |
| 2014 | 1,665.8 | 1,289.2 | 1,970.9 | 2,100.7 | 2,061.6 | 2,127.2 | 2,573.0 | 1,961.1 | 2,128.9 | 2,580.6 | 2,096.2 | 2,073.3 |
| 2015 | 1,925.6 | 1,988.1 | 2,041.7 | 2,075.8 | 1,802.4 | 2,088.0 | 2,302.0 | 2,325.7 | 2,158.8 | 2,505.0 | 2,067.4 | 1,852.7 |
| 2016 | 1,632.8 | 1,698.5 | 2,000.2 | 1,999.8 | 1,896.8 | 2,400.0 | 2,261.7 | 2,307.4 | 2,218.7 | 2,381.5 | 2,060.7 | 1,856.8 |
| 2017 | 1,645.0 | 1,735.7 | 2,163.4 | 2,108.0 | 2,209.0 | 2,489.0 | 2,497.5 | 2,220.0 | 2,244.5 | 2,528.0 | 2,386.6 | 1,921.5 |
| 2018 | 1,691.5 | 1,793.5 | 1,990.0 | 2,389.9 | 2,388.2 | 2,247.4 | 2,424.5 | 2,474.0 | 2,321.3 | 2,668.7 | 2,329.8 | 1,827.2 |
| 2019 | 1,976.0 | 1,888.7 | 1,762.6 | 2,465.2 | 2,104.3 | 2,239.0 | 2,408.7 | 2,201.4 | 2,364.3 | 2,817.3 | 2,419.6 | 1,817.3 |
| 2020 | 1,938.9 | 1,997.6 | 2,149.0 | 2,504.3 | 2,134.7 | 2,294.6 | 2,289.0 | 2,438.1 | 2,580.6 | 2,699.7 | 2,164.4 | 1,844.7 |
| 2021 | 1,941.3 | 2,086.7 | 2,179.6 | 2,616.8 | 2,359.8 | 2,674.6 | 2,548.3 | 2,655.4 | 2,522.7 | 2,617.4 | 2,425.6 | 2,196.5 |
| 2022 | 1,927.0 | 2,087.2 | 2,342.3 | |||||||||
| - = No Data Reported; -- = Not Applicable; NA = Not Available; W = Withheld to avoid disclosure of individual company data. |
| Release Date: 5/19/2022 |
| Next Release Date: TBD |