|
Download Data (XLS File) |
|
||||||||
|
||||||||
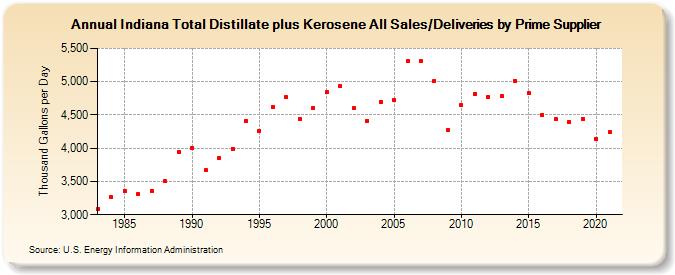
| Indiana Total Distillate plus Kerosene All Sales/Deliveries by Prime Supplier (Thousand Gallons per Day) | ||||||||
| Decade | Year-0 | Year-1 | Year-2 | Year-3 | Year-4 | Year-5 | Year-6 | Year-7 | Year-8 | Year-9 |
|---|---|---|---|---|---|---|---|---|---|---|
| 1980's | 3,089.6 | 3,260.5 | 3,362.2 | 3,307.9 | 3,362.0 | 3,500.2 | 3,937.6 | |||
| 1990's | 4,004.5 | 3,666.1 | 3,847.8 | 3,993.0 | 4,408.9 | 4,262.9 | 4,622.1 | 4,764.6 | 4,442.5 | 4,607.3 |
| 2000's | 4,837.7 | 4,929.2 | 4,597.0 | 4,414.2 | 4,697.6 | 4,720.8 | 5,303.0 | 5,304.5 | 5,012.4 | 4,276.0 |
| 2010's | 4,648.6 | 4,813.9 | 4,770.6 | 4,787.2 | 5,014.3 | 4,823.7 | 4,504.9 | 4,435.6 | 4,393.6 | 4,443.8 |
| 2020's | 4,140.6 |
| - = No Data Reported; -- = Not Applicable; NA = Not Available; W = Withheld to avoid disclosure of individual company data. |
| Release Date: 6/1/2022 |
| Next Release Date: TBD |