|
Download Data (XLS File) |
|
||||||||
|
||||||||
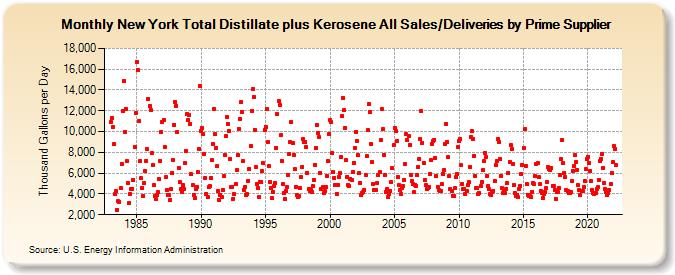
| New York Total Distillate plus Kerosene All Sales/Deliveries by Prime Supplier (Thousand Gallons per Day) | ||||||||
| Year | Jan | Feb | Mar | Apr | May | Jun | Jul | Aug | Sep | Oct | Nov | Dec |
|---|---|---|---|---|---|---|---|---|---|---|---|---|
| 1983 | 10,931.4 | 11,285.6 | 10,484.4 | 8,757.1 | 3,961.7 | 4,272.0 | 2,487.6 | 3,286.1 | 3,259.2 | 4,533.5 | 6,915.3 | 11,958.9 |
| 1984 | 14,909.8 | 9,984.1 | 12,182.8 | 7,122.9 | 5,056.7 | 3,156.3 | 3,992.9 | 4,466.3 | 4,512.1 | 5,347.9 | 8,555.2 | 11,761.5 |
| 1985 | 16,700.7 | 15,880.1 | 11,038.9 | 7,160.6 | 5,489.7 | 4,583.5 | 3,789.6 | 5,046.1 | 6,191.7 | 7,197.1 | 8,294.9 | 13,163.7 |
| 1986 | 12,440.5 | 12,111.4 | 7,960.6 | 6,816.4 | 4,838.0 | 3,797.8 | 3,482.6 | 3,932.7 | 4,157.4 | 5,430.7 | 7,180.7 | 9,982.9 |
| 1987 | 10,889.7 | 11,126.1 | 8,534.3 | 5,626.2 | 4,344.0 | 3,864.6 | 3,861.9 | 3,440.7 | 4,472.8 | 5,996.6 | 7,251.0 | 10,663.4 |
| 1988 | 12,846.0 | 12,475.4 | 9,945.2 | 6,507.1 | 5,138.8 | 4,459.0 | 4,213.4 | 4,820.7 | 4,460.4 | 6,949.6 | 8,133.6 | 11,724.0 |
| 1989 | 11,145.2 | 11,586.3 | 10,725.7 | 5,883.8 | 4,812.2 | 3,944.2 | 3,625.8 | 4,471.2 | 4,684.9 | 6,067.8 | 8,337.3 | 14,412.6 |
| 1990 | 10,038.4 | 10,377.9 | 9,732.5 | 7,811.4 | 5,546.7 | 4,022.2 | 3,672.5 | 4,672.5 | 4,762.1 | 5,563.7 | 7,263.0 | 8,841.5 |
| 1991 | 12,191.6 | 9,721.5 | 8,457.5 | 6,667.0 | 4,311.4 | 3,442.5 | 3,871.8 | 3,723.2 | 4,399.7 | 5,720.2 | 7,727.2 | 9,533.9 |
| 1992 | 11,423.0 | 10,730.4 | 10,042.0 | 7,402.8 | 4,656.8 | 4,700.3 | 3,515.9 | 3,979.7 | 4,911.7 | 6,255.1 | 7,729.4 | 10,289.4 |
| 1993 | 11,248.5 | 12,840.9 | 11,927.5 | 7,166.1 | 4,412.6 | 4,693.4 | 3,859.6 | 3,967.9 | 5,283.2 | 6,435.3 | 8,589.5 | 11,957.3 |
| 1994 | 14,115.2 | 13,357.4 | 10,172.6 | 6,617.5 | 4,998.6 | 4,528.4 | 3,715.3 | 5,191.8 | 5,144.6 | 6,173.0 | 6,942.8 | 10,138.5 |
| 1995 | 10,464.2 | 12,206.0 | 8,991.1 | 6,663.2 | 5,122.4 | 4,537.5 | 3,564.3 | 4,193.3 | 4,729.5 | 5,065.8 | 8,431.7 | 11,654.7 |
| 1996 | 12,931.1 | 12,569.0 | 9,633.5 | 7,209.8 | 4,966.9 | 4,126.6 | 3,549.5 | 4,242.6 | 4,658.7 | 5,858.5 | 7,842.0 | 8,987.1 |
| 1997 | 10,942.0 | 8,938.7 | 7,791.9 | 6,363.3 | 4,682.3 | 3,907.9 | 3,713.9 | 3,795.2 | 4,577.4 | 5,588.7 | 6,627.3 | 9,272.1 |
| 1998 | 9,019.3 | 9,033.9 | 8,535.4 | 6,045.7 | 4,445.9 | 4,305.8 | 4,340.7 | 4,165.2 | 4,725.7 | 5,366.7 | 6,808.4 | 8,424.8 |
| 1999 | 10,657.3 | 9,896.3 | 9,451.5 | 6,036.0 | 4,521.2 | 4,655.6 | 4,060.5 | 4,251.2 | 4,656.0 | 5,742.5 | 7,121.4 | 9,734.5 |
| 2000 | 11,139.7 | 10,878.8 | 7,901.7 | 6,072.3 | 5,559.4 | 4,880.8 | 4,025.3 | 4,834.9 | 5,628.0 | 6,015.1 | 7,537.0 | 11,496.7 |
| 2001 | 13,256.2 | 12,073.6 | 10,368.6 | 7,240.3 | 5,656.3 | 4,812.2 | 4,769.7 | 5,474.4 | 5,378.2 | 6,154.0 | 7,003.5 | 8,455.5 |
| 2002 | 9,989.0 | 9,112.4 | 7,709.3 | 6,001.2 | 5,055.7 | 3,896.2 | 4,107.3 | 4,202.0 | 4,407.4 | 5,844.8 | 7,627.9 | 10,113.9 |
| 2003 | 12,649.2 | 11,846.4 | 8,835.7 | 7,078.0 | 4,966.8 | 4,344.9 | 4,421.7 | 4,398.8 | 5,032.7 | 5,811.6 | 6,099.6 | 9,167.6 |
| 2004 | 12,139.8 | 10,238.2 | 7,779.7 | 5,857.4 | 4,185.4 | 4,449.3 | 3,694.3 | 4,011.0 | 4,319.4 | 5,170.7 | 6,488.2 | 8,658.4 |
| 2005 | 10,385.0 | 10,045.6 | 9,098.3 | 5,638.3 | 4,867.7 | 4,383.2 | 3,994.6 | 4,605.0 | 4,762.9 | 5,386.9 | 6,866.8 | 9,742.2 |
| 2006 | 9,172.4 | 9,539.0 | 8,749.7 | 5,835.8 | 5,229.0 | 4,907.7 | 4,196.3 | 4,891.2 | 4,807.6 | 5,836.5 | 6,614.9 | 7,397.6 |
| 2007 | 9,252.3 | 12,022.8 | 8,934.0 | 6,953.2 | 5,310.6 | 4,830.2 | 4,511.0 | 4,559.5 | 4,686.2 | 5,922.6 | 7,254.6 | 8,831.6 |
| 2008 | 9,087.1 | 9,214.0 | 7,462.3 | 5,722.7 | 4,694.1 | 4,391.6 | 4,240.4 | 4,262.8 | 4,930.6 | 5,944.9 | 6,277.2 | 8,814.4 |
| 2009 | 10,765.2 | 9,006.0 | 7,526.7 | 5,744.1 | 4,462.1 | 4,237.7 | 3,832.7 | 3,807.1 | 4,530.2 | 5,582.0 | 5,921.6 | 8,546.3 |
| 2010 | 9,127.7 | 9,272.9 | 6,745.7 | 4,967.9 | 4,474.7 | 4,480.6 | 3,993.9 | 4,241.3 | 4,877.1 | 5,146.7 | 6,628.1 | 9,503.6 |
| 2011 | 10,029.8 | 9,299.6 | 7,655.4 | 5,767.1 | 4,532.2 | 4,568.4 | 3,968.9 | 4,090.1 | 4,721.9 | 5,122.9 | 6,261.8 | 7,143.1 |
| 2012 | 7,983.9 | 7,569.9 | 5,734.3 | 4,777.7 | 4,459.8 | 4,020.5 | 3,932.2 | 4,217.1 | 4,306.9 | 5,234.1 | 6,775.6 | 7,205.6 |
| 2013 | 9,249.5 | 8,951.5 | 7,374.1 | 5,756.6 | 4,568.8 | 4,103.2 | 4,297.5 | 4,054.0 | 4,500.1 | 5,026.4 | 6,008.1 | 7,077.8 |
| 2014 | 8,689.6 | 8,286.4 | 6,912.1 | 4,845.7 | 4,089.3 | 3,780.5 | 3,874.8 | 3,673.8 | 4,478.1 | 4,796.1 | 5,899.2 | 6,791.8 |
| 2015 | 8,393.4 | 10,240.2 | 6,700.1 | 4,949.7 | 3,913.0 | 3,837.3 | 3,817.1 | 3,745.1 | 4,229.5 | 5,066.1 | 4,933.7 | 5,721.3 |
| 2016 | 6,926.7 | 6,985.9 | 5,621.6 | 4,926.4 | 4,295.0 | 4,093.0 | 3,605.2 | 4,009.1 | 4,184.9 | 4,563.5 | 5,111.5 | 6,596.9 |
| 2017 | 6,375.7 | 6,285.4 | 6,535.5 | 4,783.6 | 4,714.7 | 4,389.2 | 3,550.6 | 4,217.6 | 4,203.2 | 4,567.9 | 5,777.6 | 7,370.7 |
| 2018 | 9,175.5 | 6,942.1 | 6,018.1 | 5,647.8 | 4,367.8 | 4,289.1 | 4,041.5 | 4,087.7 | 4,203.1 | 5,207.5 | 6,253.2 | 6,702.1 |
| 2019 | 7,716.8 | 7,117.9 | 6,342.4 | 4,817.7 | 4,387.1 | 3,850.9 | 4,264.1 | 4,252.6 | 4,680.3 | 5,272.4 | 6,372.5 | 7,367.4 |
| 2020 | 7,581.0 | 6,990.0 | 6,199.8 | 5,210.9 | 4,421.6 | 4,060.9 | 3,979.1 | 4,054.7 | 4,484.8 | 4,627.5 | 5,374.3 | 7,144.5 |
| 2021 | 7,405.6 | 7,853.7 | 6,540.0 | 5,075.8 | 4,484.9 | 4,226.1 | 3,852.3 | 4,052.0 | 4,415.9 | 4,993.3 | 6,060.7 | 7,044.1 |
| 2022 | 8,579.3 | 8,319.9 | 6,810.1 | |||||||||
| - = No Data Reported; -- = Not Applicable; NA = Not Available; W = Withheld to avoid disclosure of individual company data. |
| Release Date: 5/19/2022 |
| Next Release Date: TBD |