|
Download Data (XLS File) |
|
||||||||
|
||||||||
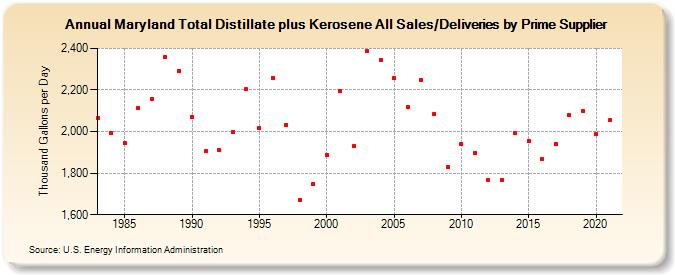
| Maryland Total Distillate plus Kerosene All Sales/Deliveries by Prime Supplier (Thousand Gallons per Day) | ||||||||
| Decade | Year-0 | Year-1 | Year-2 | Year-3 | Year-4 | Year-5 | Year-6 | Year-7 | Year-8 | Year-9 |
|---|---|---|---|---|---|---|---|---|---|---|
| 1980's | 2,067.0 | 1,994.3 | 1,944.9 | 2,114.3 | 2,158.4 | 2,356.6 | 2,293.0 | |||
| 1990's | 2,072.0 | 1,905.5 | 1,909.3 | 1,995.7 | 2,203.0 | 2,016.9 | 2,259.1 | 2,031.9 | 1,672.2 | 1,746.9 |
| 2000's | 1,889.2 | 2,194.0 | 1,928.4 | 2,386.0 | 2,342.3 | 2,258.7 | 2,119.3 | 2,250.0 | 2,084.7 | 1,828.8 |
| 2010's | 1,941.0 | 1,898.0 | 1,764.9 | 1,765.2 | 1,991.6 | 1,955.7 | 1,868.1 | 1,940.8 | 2,077.7 | 2,099.3 |
| 2020's | 1,987.1 |
| - = No Data Reported; -- = Not Applicable; NA = Not Available; W = Withheld to avoid disclosure of individual company data. |
| Release Date: 6/1/2022 |
| Next Release Date: TBD |