|
Download Data (XLS File) |
|
||||||||
|
||||||||
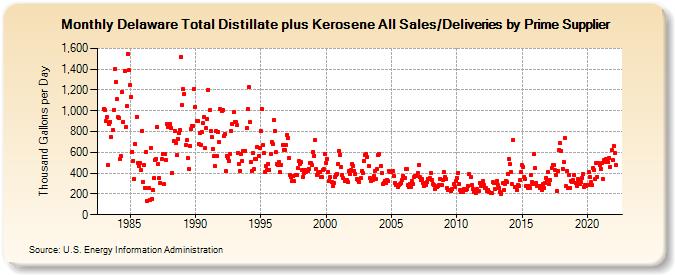
| Delaware Total Distillate plus Kerosene All Sales/Deliveries by Prime Supplier (Thousand Gallons per Day) | ||||||||
| Year | Jan | Feb | Mar | Apr | May | Jun | Jul | Aug | Sep | Oct | Nov | Dec |
|---|---|---|---|---|---|---|---|---|---|---|---|---|
| 1983 | 1,020.5 | 1,003.1 | 901.4 | 935.4 | 473.8 | 870.2 | 894.8 | 747.1 | 814.5 | 1,009.8 | 1,398.8 | 1,278.4 |
| 1984 | 1,109.8 | 935.4 | 934.4 | 533.5 | 561.2 | 1,176.9 | 891.9 | 1,382.1 | 848.5 | 1,045.4 | 1,548.1 | 1,391.0 |
| 1985 | 1,247.7 | 1,133.3 | 607.2 | 517.7 | 345.9 | 680.7 | 943.7 | 498.2 | 466.6 | 499.6 | 426.9 | 806.4 |
| 1986 | 317.6 | 482.7 | 261.1 | 606.2 | 127.7 | 256.8 | 141.3 | 644.5 | 154.5 | 238.1 | 351.3 | 527.1 |
| 1987 | 539.9 | 841.6 | 487.4 | 353.4 | 309.2 | 533.7 | 580.1 | 293.3 | 579.9 | 528.4 | 871.4 | 845.4 |
| 1988 | 862.2 | 873.1 | 834.8 | 403.3 | 704.4 | 809.6 | 689.2 | 570.3 | 732.6 | 788.3 | 813.6 | 1,516.6 |
| 1989 | 1,056.5 | 1,206.5 | 1,163.4 | 669.5 | 714.8 | 544.0 | 440.4 | 665.0 | 827.7 | 857.5 | 857.8 | 1,212.8 |
| 1990 | 1,039.2 | 905.9 | 898.0 | 680.3 | 787.1 | 673.8 | 797.7 | 881.6 | 936.9 | 641.1 | 830.0 | 923.6 |
| 1991 | 1,200.2 | 1,004.7 | 801.0 | 745.1 | 635.1 | 561.8 | 466.4 | 805.1 | 564.3 | 798.9 | 698.6 | 1,015.1 |
| 1992 | 1,002.5 | 1,007.1 | 752.5 | 775.0 | 416.7 | 563.2 | 546.9 | 516.5 | 584.1 | 809.1 | 870.3 | 984.1 |
| 1993 | 893.5 | 891.3 | 864.0 | 596.4 | 485.5 | 419.7 | 579.6 | 518.9 | 609.0 | 612.5 | 615.5 | 833.8 |
| 1994 | 1,015.1 | 1,227.3 | 890.7 | 503.9 | 417.8 | 589.9 | 435.6 | 532.5 | 534.6 | 654.2 | 564.3 | 640.7 |
| 1995 | 809.2 | 1,017.5 | 668.6 | 593.4 | 411.4 | 472.5 | 430.5 | 490.8 | 431.2 | 584.6 | 703.6 | 676.5 |
| 1996 | 914.4 | 807.0 | 599.8 | 485.8 | 475.4 | 508.1 | 406.4 | 482.5 | 666.0 | 626.0 | 624.1 | 674.5 |
| 1997 | 768.3 | 738.8 | 546.6 | 384.3 | 358.3 | 324.9 | 372.6 | 321.5 | 379.2 | 381.1 | 446.1 | 513.0 |
| 1998 | 488.5 | 503.9 | 434.2 | 364.8 | 398.1 | 431.4 | 414.6 | 422.0 | 442.9 | 495.3 | 497.0 | 473.6 |
| 1999 | 605.0 | 569.6 | 716.7 | 436.0 | 386.5 | 402.9 | 414.3 | 360.4 | 362.1 | 427.2 | 435.8 | 580.7 |
| 2000 | 498.9 | 536.6 | 411.7 | 327.8 | 361.0 | 317.4 | 272.7 | 306.9 | 367.6 | 379.6 | 396.2 | 484.0 |
| 2001 | 612.7 | 578.8 | 456.2 | 383.2 | 350.5 | 327.1 | 331.8 | 330.2 | 314.8 | 417.0 | 393.2 | 434.8 |
| 2002 | 492.3 | 472.8 | 420.6 | 395.7 | 344.7 | 330.4 | 318.7 | W | 348.5 | 424.0 | 397.6 | 518.7 |
| 2003 | 579.0 | 580.8 | 553.5 | 470.1 | 349.8 | 327.9 | 338.3 | 334.0 | 376.1 | 421.7 | 339.6 | 438.3 |
| 2004 | 574.0 | 584.3 | 467.9 | 400.9 | 295.5 | 305.8 | 327.8 | 301.1 | 337.3 | 325.1 | 419.2 | 415.4 |
| 2005 | 412.0 | 419.8 | 373.4 | 307.6 | 287.2 | 288.2 | 265.1 | 290.1 | 293.7 | 301.4 | 334.8 | 373.9 |
| 2006 | 357.1 | 436.2 | 440.0 | 286.5 | 268.5 | 296.6 | 269.2 | 320.3 | 292.2 | 358.3 | 370.1 | 368.3 |
| 2007 | 401.5 | 481.6 | 359.3 | 333.9 | 345.1 | 301.1 | 280.6 | 300.7 | 288.1 | 313.2 | 346.7 | 350.3 |
| 2008 | 400.6 | 337.7 | 292.6 | 286.7 | 246.7 | 263.6 | 264.0 | 277.4 | 284.0 | 347.0 | 284.9 | 332.7 |
| 2009 | 415.3 | 363.4 | 343.6 | 257.0 | 239.7 | 235.1 | 237.5 | 228.5 | 250.2 | 291.9 | 266.3 | 320.5 |
| 2010 | 355.6 | 402.1 | 295.4 | 234.4 | 218.1 | 229.0 | 221.3 | 244.8 | 242.3 | 247.4 | 277.0 | 387.2 |
| 2011 | NA | 364.3 | 285.7 | 249.1 | 219.0 | 234.4 | 209.8 | 247.1 | 231.1 | 306.7 | 277.2 | 309.8 |
| 2012 | 320.2 | 289.4 | 260.0 | 252.9 | 230.1 | 241.6 | 216.1 | 213.2 | 212.7 | 311.8 | 304.3 | 248.1 |
| 2013 | 309.6 | 329.0 | 282.3 | 259.8 | 215.9 | 200.5 | 302.1 | 236.3 | 296.3 | 328.5 | 312.9 | 390.3 |
| 2014 | 534.2 | 483.5 | 410.9 | 291.0 | 716.4 | 264.8 | 265.2 | 235.0 | 289.5 | 279.3 | 330.6 | 408.5 |
| 2015 | 474.4 | 463.2 | 365.4 | 344.0 | 279.0 | 254.9 | 272.7 | 253.1 | 384.4 | 315.8 | 295.5 | 581.2 |
| 2016 | 450.3 | 304.6 | 277.6 | 277.0 | 260.1 | 280.1 | 236.5 | 290.7 | 260.5 | 308.5 | 357.2 | 338.6 |
| 2017 | 410.1 | 292.8 | 330.2 | 453.4 | 479.5 | 475.3 | 432.3 | 377.9 | 226.2 | 419.8 | 625.7 | 690.8 |
| 2018 | 612.4 | 443.5 | 507.4 | 740.1 | 272.0 | 422.5 | 260.7 | 385.4 | 257.8 | 326.6 | 317.7 | 336.6 |
| 2019 | 378.6 | 302.4 | 280.6 | 343.5 | 307.5 | 292.6 | 310.8 | 356.2 | 392.1 | 264.8 | 290.3 | 276.9 |
| 2020 | 281.1 | 406.6 | 367.0 | 312.0 | 287.0 | 447.6 | 430.3 | 342.9 | 499.8 | 366.1 | 497.3 | 478.7 |
| 2021 | 442.7 | 494.9 | 347.4 | 522.6 | 505.1 | 533.4 | 511.8 | 506.6 | 547.7 | 462.1 | 619.5 | 522.9 |
| 2022 | 661.4 | 590.8 | 477.0 | |||||||||
| - = No Data Reported; -- = Not Applicable; NA = Not Available; W = Withheld to avoid disclosure of individual company data. |
| Release Date: 5/19/2022 |
| Next Release Date: TBD |