|
Download Data (XLS File) |
|
||||||||
|
||||||||
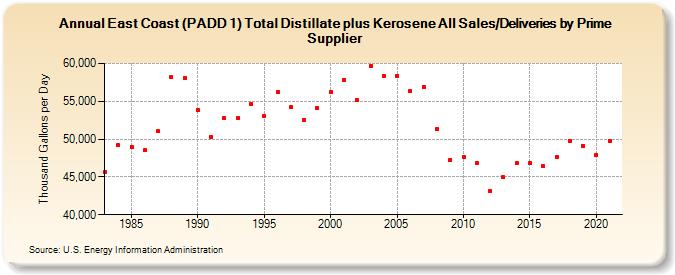
| East Coast (PADD 1) Total Distillate plus Kerosene All Sales/Deliveries by Prime Supplier (Thousand Gallons per Day) | ||||||||
| Decade | Year-0 | Year-1 | Year-2 | Year-3 | Year-4 | Year-5 | Year-6 | Year-7 | Year-8 | Year-9 |
|---|---|---|---|---|---|---|---|---|---|---|
| 1980's | 45,610.0 | 49,179.5 | 48,991.9 | 48,495.1 | 51,033.7 | 58,156.2 | 58,106.3 | |||
| 1990's | 53,839.3 | 50,293.9 | 52,748.6 | 52,850.2 | 54,656.7 | 52,998.3 | 56,183.7 | 54,213.4 | 52,527.4 | 54,067.8 |
| 2000's | 56,219.4 | 57,853.3 | 55,158.4 | 59,714.1 | 58,335.9 | 58,366.0 | 56,316.5 | 56,922.0 | 51,328.7 | 47,270.8 |
| 2010's | 47,617.5 | 46,874.6 | 43,114.2 | 44,922.4 | 46,803.2 | 46,871.6 | 46,436.3 | 47,611.1 | 49,791.7 | 49,148.1 |
| 2020's | 47,921.1 |
| - = No Data Reported; -- = Not Applicable; NA = Not Available; W = Withheld to avoid disclosure of individual company data. |
| Release Date: 6/1/2022 |
| Next Release Date: TBD |