|
Download Data (XLS File) |
|
||||||||
|
||||||||
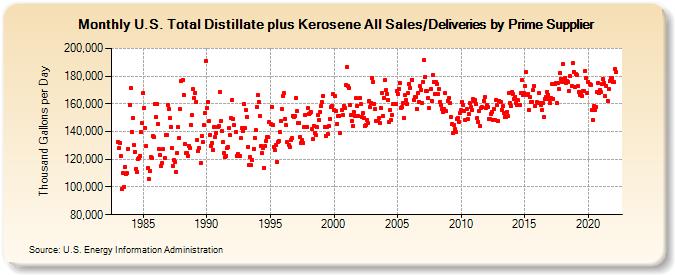
| U.S. Total Distillate plus Kerosene All Sales/Deliveries by Prime Supplier (Thousand Gallons per Day) | ||||||||
| Year | Jan | Feb | Mar | Apr | May | Jun | Jul | Aug | Sep | Oct | Nov | Dec |
|---|---|---|---|---|---|---|---|---|---|---|---|---|
| 1983 | 132,511.0 | 127,907.0 | 131,963.9 | 122,106.2 | 98,592.6 | 109,788.3 | 100,179.8 | 114,581.4 | 109,214.3 | 109,759.5 | 127,742.4 | 159,240.0 |
| 1984 | 171,550.0 | 139,804.2 | 149,881.1 | 130,208.2 | 125,439.4 | 113,180.2 | 110,675.4 | 120,028.1 | 121,139.0 | 122,456.9 | 139,326.6 | 146,015.0 |
| 1985 | 167,695.1 | 157,029.4 | 142,744.2 | 129,578.3 | 113,540.8 | 106,041.4 | 111,182.4 | 121,472.9 | 120,935.6 | 136,639.7 | 136,042.7 | 160,166.1 |
| 1986 | 150,381.1 | 159,857.4 | 145,562.1 | 127,055.0 | 123,235.5 | 115,055.7 | 117,388.8 | 127,387.4 | 121,037.1 | 137,296.6 | 137,560.0 | 158,972.3 |
| 1987 | 156,450.0 | 149,707.4 | 143,621.7 | 128,116.9 | 115,484.9 | 119,444.2 | 118,325.9 | 110,845.8 | 124,532.2 | 143,200.5 | 135,181.2 | 155,944.4 |
| 1988 | 176,152.3 | 177,354.0 | 166,594.8 | 130,818.4 | 124,189.3 | 124,786.2 | 122,416.7 | 129,896.7 | 128,188.9 | 144,760.0 | 151,608.8 | 170,355.4 |
| 1989 | 164,381.1 | 167,848.1 | 161,642.5 | 134,176.0 | 125,869.7 | 128,176.1 | 117,198.7 | 136,870.4 | 132,428.0 | 144,499.0 | 153,329.1 | 191,152.6 |
| 1990 | 157,129.7 | 161,678.4 | 147,366.0 | 137,466.6 | 129,776.2 | 131,891.7 | 126,787.5 | 143,618.1 | 135,975.5 | 139,242.2 | 143,363.7 | 143,747.4 |
| 1991 | 168,347.9 | 147,642.4 | 140,207.2 | 132,143.1 | 124,733.6 | 121,377.7 | 122,699.6 | 128,082.1 | 128,614.8 | 142,231.9 | 137,278.5 | 149,550.4 |
| 1992 | 162,996.8 | 149,318.8 | 144,582.4 | 139,433.2 | 122,597.5 | 124,092.5 | 122,434.1 | 122,210.4 | 135,122.6 | 142,302.3 | 140,257.6 | 160,038.3 |
| 1993 | 142,679.8 | 155,716.6 | 150,618.2 | 129,204.2 | 116,162.1 | 121,610.8 | 115,644.8 | 119,180.4 | 127,733.5 | 135,400.3 | 140,851.0 | 157,489.1 |
| 1994 | 166,254.0 | 161,667.0 | 151,008.7 | 129,530.2 | 124,439.5 | 128,439.0 | 114,011.8 | 129,422.0 | 133,451.0 | 135,778.0 | 135,869.3 | 146,791.7 |
| 1995 | 145,231.2 | 157,925.9 | 144,957.9 | 129,138.2 | 126,441.7 | 130,479.9 | 118,004.1 | 132,489.2 | 133,003.5 | 139,418.6 | 147,569.7 | 156,104.4 |
| 1996 | 165,833.6 | 167,599.4 | 149,268.5 | 144,402.3 | 132,808.8 | 130,359.0 | 128,573.1 | 134,056.5 | 135,061.1 | 151,257.7 | 150,732.2 | 151,440.7 |
| 1997 | 164,331.1 | 154,622.5 | 146,488.3 | 146,373.9 | 136,341.6 | 131,456.3 | 133,968.1 | 131,843.4 | 143,124.6 | 152,255.9 | 143,339.9 | 156,725.0 |
| 1998 | 152,927.6 | 153,087.9 | 154,173.8 | 141,558.9 | 134,271.8 | 144,189.9 | 138,842.6 | 137,215.7 | 143,171.5 | 151,762.5 | 148,500.0 | 154,255.0 |
| 1999 | 158,613.8 | 161,037.2 | 165,870.3 | 143,252.5 | 136,961.1 | 143,253.5 | 138,294.6 | 143,740.7 | 148,759.5 | 158,038.7 | 158,694.0 | 167,236.7 |
| 2000 | 155,769.5 | 165,749.0 | 154,950.2 | 145,774.8 | 150,944.5 | 151,409.2 | 138,614.4 | 155,694.7 | 151,764.5 | 158,637.8 | 157,148.6 | 173,416.6 |
| 2001 | 186,912.0 | 173,011.8 | 171,411.5 | 159,507.0 | 151,723.7 | 147,487.5 | 144,109.3 | 154,016.4 | 150,998.2 | 163,925.9 | 158,158.0 | 151,367.7 |
| 2002 | 164,208.0 | 159,795.9 | 150,787.0 | 153,307.9 | 149,525.8 | 144,018.3 | 144,387.2 | 148,340.3 | 145,878.8 | 161,905.6 | 157,457.5 | 160,627.2 |
| 2003 | 178,986.3 | 175,866.0 | 160,141.8 | 156,422.4 | 147,829.7 | 147,354.4 | 149,638.8 | 146,053.5 | 157,234.8 | 167,968.8 | 151,367.5 | 164,514.7 |
| 2004 | 176,951.8 | 169,867.1 | 167,415.2 | 162,953.5 | 146,646.5 | 155,607.0 | 148,401.9 | 152,289.1 | 159,681.4 | 160,116.5 | 159,970.1 | 169,134.3 |
| 2005 | 167,116.1 | 170,973.1 | 174,996.8 | 157,328.2 | 157,420.7 | 160,657.9 | 149,939.3 | 166,063.0 | 162,904.0 | 160,052.7 | 167,629.2 | 174,402.1 |
| 2006 | 171,680.1 | 177,259.2 | 177,457.4 | 162,901.7 | 164,609.0 | 164,851.2 | 156,553.3 | 167,595.4 | 161,365.0 | 172,638.5 | 170,185.4 | 160,822.1 |
| 2007 | 176,070.6 | 191,570.1 | 179,443.6 | 169,272.2 | 169,183.6 | 164,172.5 | 156,698.4 | 170,416.1 | 162,378.8 | 180,626.5 | 176,072.5 | 166,812.0 |
| 2008 | 176,105.8 | 174,396.0 | 166,864.3 | 170,711.0 | 161,359.8 | 158,834.3 | 156,068.9 | 153,957.9 | 156,506.5 | 167,575.1 | 154,590.6 | 162,273.5 |
| 2009 | 164,090.7 | 160,468.8 | 150,848.8 | 145,099.8 | 139,093.6 | 144,574.6 | 141,619.6 | 139,866.5 | 148,891.8 | 150,037.6 | 146,777.5 | 153,691.3 |
| 2010 | 155,297.0 | 161,464.8 | 158,890.2 | 154,634.7 | 148,427.9 | 156,011.3 | 149,077.6 | 152,606.6 | 160,386.8 | 157,840.1 | 155,415.9 | 163,348.9 |
| 2011 | 161,982.9 | 163,110.2 | 160,059.2 | 149,589.9 | 147,071.2 | 154,863.8 | 143,794.8 | 156,961.6 | 157,643.2 | 162,380.0 | 164,803.8 | 157,125.1 |
| 2012 | 159,471.2 | 157,516.1 | 149,129.5 | 149,158.4 | 152,755.3 | 154,153.3 | 148,007.8 | 156,582.3 | 148,022.2 | 163,015.7 | 159,136.8 | 147,767.1 |
| 2013 | 162,243.5 | 161,596.5 | 155,863.0 | 158,110.5 | 153,279.5 | 150,543.5 | 150,826.0 | 154,151.9 | 150,875.6 | 167,713.8 | 160,329.9 | 158,313.7 |
| 2014 | 168,892.0 | 167,145.9 | 163,407.6 | 165,289.2 | 160,452.1 | 159,105.6 | 162,416.0 | 159,400.8 | 167,498.4 | 177,166.9 | 166,650.0 | 167,905.6 |
| 2015 | 173,210.4 | 182,638.8 | 166,504.8 | 166,819.1 | 155,452.3 | 164,811.5 | 161,263.6 | 161,511.8 | 169,757.7 | 173,043.6 | 158,219.8 | 161,019.5 |
| 2016 | 160,908.1 | 167,834.6 | 160,802.3 | 159,153.7 | 155,878.8 | 160,269.7 | 150,723.7 | 163,378.9 | 165,098.9 | 168,800.9 | 166,708.0 | 163,282.6 |
| 2017 | 160,368.9 | 164,102.9 | 174,097.1 | 163,722.5 | 174,332.3 | 174,901.3 | 160,562.6 | 174,801.5 | 170,694.9 | 182,261.5 | 178,271.0 | 175,987.1 |
| 2018 | 188,536.8 | 177,189.8 | 178,969.4 | 175,121.7 | 176,145.4 | 175,943.6 | 169,615.6 | 179,945.7 | 172,870.9 | 189,162.8 | 183,122.1 | 172,378.6 |
| 2019 | 181,455.3 | 180,606.9 | 172,609.0 | 168,757.7 | 166,639.0 | 166,935.0 | 165,670.7 | 169,375.9 | 169,130.0 | 183,796.5 | 178,484.0 | 168,173.3 |
| 2020 | 175,873.5 | 174,383.1 | 173,836.2 | 155,553.3 | 148,545.5 | 158,460.9 | 155,733.7 | 158,022.6 | 168,202.0 | 175,212.5 | 167,584.5 | 170,066.4 |
| 2021 | 168,241.8 | 174,457.6 | 177,684.5 | 174,970.7 | 165,425.8 | 173,012.8 | 162,244.7 | 170,779.2 | 176,217.3 | 178,414.8 | 178,484.3 | 175,498.7 |
| 2022 | 175,833.9 | 185,299.4 | 182,628.9 | |||||||||
| - = No Data Reported; -- = Not Applicable; NA = Not Available; W = Withheld to avoid disclosure of individual company data. |
| Release Date: 5/19/2022 |
| Next Release Date: TBD |