|
Download Data (XLS File) |
|
||||||||
|
||||||||
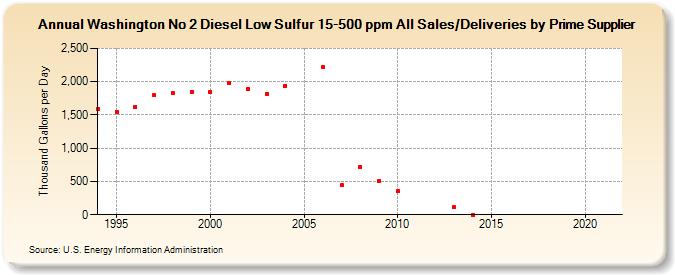
| Washington No 2 Diesel Low Sulfur 15-500 ppm All Sales/Deliveries by Prime Supplier (Thousand Gallons per Day) | ||||||||
| Decade | Year-0 | Year-1 | Year-2 | Year-3 | Year-4 | Year-5 | Year-6 | Year-7 | Year-8 | Year-9 |
|---|---|---|---|---|---|---|---|---|---|---|
| 1990's | 1,593.8 | 1,551.4 | 1,619.3 | 1,795.0 | 1,829.0 | 1,850.2 | ||||
| 2000's | 1,850.5 | 1,979.6 | 1,893.3 | 1,811.0 | 1,939.6 | W | 2,223.7 | 446.2 | 716.7 | 507.7 |
| 2010's | 354.5 | W | W | 108.7 | 0.7 | W | - | - | - | - |
| 2020's | - |
| - = No Data Reported; -- = Not Applicable; NA = Not Available; W = Withheld to avoid disclosure of individual company data. |
| Release Date: 6/1/2022 |
| Next Release Date: TBD |