|
Download Data (XLS File) |
|
||||||||
|
||||||||
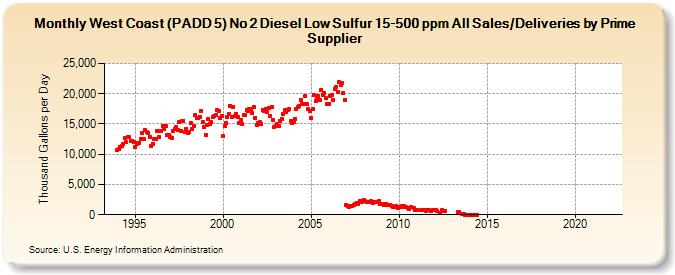
| West Coast (PADD 5) No 2 Diesel Low Sulfur 15-500 ppm All Sales/Deliveries by Prime Supplier (Thousand Gallons per Day) | ||||||||
| Year | Jan | Feb | Mar | Apr | May | Jun | Jul | Aug | Sep | Oct | Nov | Dec |
|---|---|---|---|---|---|---|---|---|---|---|---|---|
| 1993 | NA | NA | NA | |||||||||
| 1994 | 10,645.0 | 10,821.4 | 11,150.2 | 11,333.0 | 11,711.5 | 12,647.3 | 11,945.2 | 12,844.7 | 12,796.9 | 12,191.0 | 12,252.9 | 12,008.0 |
| 1995 | 11,125.9 | 11,649.9 | 11,908.9 | 11,912.3 | 12,520.9 | 13,528.7 | 12,569.6 | 13,991.1 | 13,591.5 | 13,469.0 | 12,926.6 | 11,320.0 |
| 1996 | 11,740.0 | 12,489.6 | 12,547.3 | 13,902.1 | 12,830.5 | 13,833.9 | 13,859.7 | 14,628.0 | 14,146.3 | 14,604.6 | 13,247.1 | 13,124.2 |
| 1997 | 12,921.7 | 12,697.9 | 13,758.2 | 14,088.8 | 14,421.6 | 14,043.3 | 15,276.3 | 13,869.1 | 15,415.4 | 15,540.5 | 13,599.3 | 14,161.4 |
| 1998 | 13,556.5 | 13,671.9 | 15,079.6 | 14,184.1 | 14,674.2 | 16,405.4 | 15,962.6 | 15,992.6 | 16,195.7 | 17,128.8 | 15,340.3 | 14,576.3 |
| 1999 | 13,227.6 | 14,814.2 | 15,773.6 | 14,963.1 | 15,262.3 | 16,190.5 | 16,317.9 | 16,426.6 | 17,276.9 | 17,084.1 | 15,979.0 | 16,370.5 |
| 2000 | 13,027.5 | 14,705.7 | 15,182.3 | 16,101.9 | 16,588.3 | 18,043.0 | 16,146.6 | 17,886.1 | 16,316.8 | 16,722.9 | 16,201.3 | 15,204.5 |
| 2001 | 15,672.1 | 15,048.7 | 16,428.8 | 16,477.3 | 17,264.3 | 17,124.6 | 17,404.1 | 17,470.2 | 16,828.3 | 17,794.5 | 16,007.3 | 14,832.5 |
| 2002 | 15,235.0 | 15,267.1 | 15,047.6 | 17,344.6 | 17,111.9 | 17,449.9 | 16,997.7 | 17,634.8 | 16,315.2 | 17,757.0 | 15,646.6 | 14,534.5 |
| 2003 | 14,594.8 | 14,980.3 | 14,639.8 | 15,540.6 | 15,818.9 | 16,713.3 | 17,249.3 | 16,954.6 | 17,319.9 | 17,432.1 | 15,527.6 | 15,159.4 |
| 2004 | 15,265.3 | 15,886.2 | 17,526.4 | 17,778.1 | 17,930.5 | 19,032.2 | 18,363.0 | 18,249.5 | 19,611.2 | 18,239.7 | 17,500.3 | 17,182.7 |
| 2005 | 16,013.9 | 17,514.6 | 19,810.0 | 18,832.7 | 19,296.3 | 19,618.7 | 18,904.4 | 20,658.0 | 19,841.1 | 20,058.1 | 19,225.5 | 18,343.4 |
| 2006 | 18,372.2 | 19,588.4 | 19,752.1 | 19,044.4 | 20,792.7 | 21,042.2 | 20,319.3 | 21,871.1 | 21,468.2 | 21,788.5 | 20,174.9 | 18,886.4 |
| 2007 | 1,567.7 | 1,440.9 | 1,280.7 | 1,360.8 | 1,364.5 | 1,679.7 | 1,817.0 | 2,013.9 | 1,843.6 | 2,299.2 | 2,230.8 | 2,161.5 |
| 2008 | 2,409.3 | 2,282.3 | 2,048.4 | 2,175.5 | 2,051.2 | 2,222.1 | 1,908.5 | 2,046.8 | 2,131.4 | 2,127.9 | 2,192.3 | 1,724.5 |
| 2009 | 1,756.0 | 1,800.2 | 1,568.9 | 1,698.6 | 1,622.6 | 1,677.1 | 1,605.1 | 1,474.2 | 1,294.9 | 1,313.9 | 1,380.2 | 1,172.6 |
| 2010 | 1,201.8 | 1,242.4 | 1,364.6 | 1,367.0 | 1,297.2 | 1,219.4 | 1,052.9 | 1,007.2 | 1,262.3 | W | 1,147.3 | 801.3 |
| 2011 | 820.6 | W | W | 697.8 | 793.7 | 831.2 | 690.1 | 750.8 | 741.7 | W | 662.0 | 818.1 |
| 2012 | 798.9 | 805.0 | 570.3 | W | 328.0 | 725.6 | 578.1 | 635.3 | W | W | W | W |
| 2013 | W | W | W | W | 526.5 | 481.5 | W | 117.7 | 90.6 | 27.1 | 18.1 | 11.5 |
| 2014 | 10.3 | 19.0 | W | 21.6 | 28.5 | 20.7 | W | W | W | W | W | W |
| 2015 | W | W | W | W | W | W | W | W | W | W | W | W |
| 2016 | W | W | W | W | W | W | W | W | W | W | W | W |
| 2017 | W | W | W | W | W | W | W | W | W | W | W | W |
| 2018 | W | W | W | W | W | W | W | W | W | W | W | W |
| 2019 | W | W | W | W | W | W | W | W | W | W | W | W |
| 2020 | W | W | W | W | W | W | W | W | W | NA | W | W |
| 2021 | - | - | - | - | - | - | - | - | - | - | - | - |
| 2022 | - | - | - | |||||||||
| - = No Data Reported; -- = Not Applicable; NA = Not Available; W = Withheld to avoid disclosure of individual company data. |
| Release Date: 5/19/2022 |
| Next Release Date: TBD |