|
Download Data (XLS File) |
|
||||||||
|
||||||||
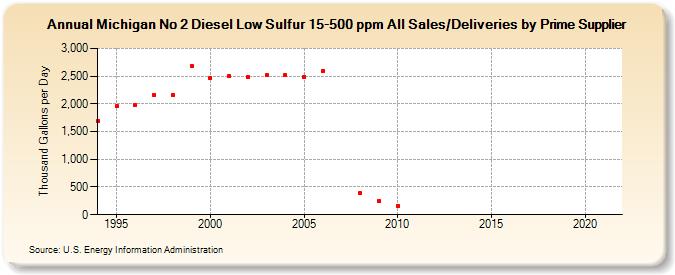
| Michigan No 2 Diesel Low Sulfur 15-500 ppm All Sales/Deliveries by Prime Supplier (Thousand Gallons per Day) | ||||||||
| Decade | Year-0 | Year-1 | Year-2 | Year-3 | Year-4 | Year-5 | Year-6 | Year-7 | Year-8 | Year-9 |
|---|---|---|---|---|---|---|---|---|---|---|
| 1990's | 1,697.3 | 1,954.2 | 1,981.3 | 2,164.0 | 2,158.5 | 2,685.9 | ||||
| 2000's | 2,464.1 | 2,499.3 | 2,481.3 | 2,518.1 | 2,523.2 | 2,490.5 | 2,592.6 | W | 389.8 | 250.6 |
| 2010's | 163.2 | W | W | - | - | - | - | - | - | - |
| 2020's | W |
| - = No Data Reported; -- = Not Applicable; NA = Not Available; W = Withheld to avoid disclosure of individual company data. |
| Release Date: 6/1/2022 |
| Next Release Date: TBD |