|
Download Data (XLS File) |
|
||||||||
|
||||||||
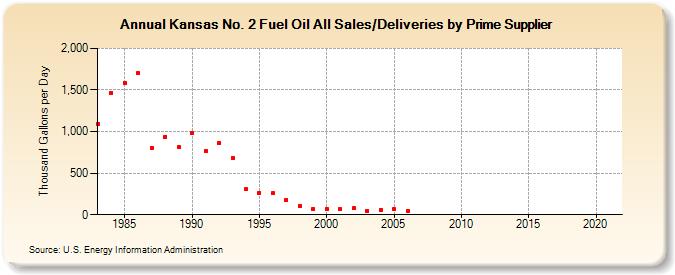
| Kansas No. 2 Fuel Oil All Sales/Deliveries by Prime Supplier (Thousand Gallons per Day) | ||||||||
| Decade | Year-0 | Year-1 | Year-2 | Year-3 | Year-4 | Year-5 | Year-6 | Year-7 | Year-8 | Year-9 |
|---|---|---|---|---|---|---|---|---|---|---|
| 1980's | 1,096.7 | 1,468.8 | 1,584.2 | 1,699.5 | 807.3 | 939.9 | 815.1 | |||
| 1990's | 978.0 | 767.0 | 864.2 | 685.3 | 306.0 | 263.5 | 257.4 | 182.4 | 104.3 | 67.6 |
| 2000's | 69.0 | 71.3 | 74.9 | 47.4 | 57.9 | 67.3 | 50.1 | W | - | - |
| 2010's | W | W | - | - | - | - | - | - | - | - |
| 2020's | W |
| - = No Data Reported; -- = Not Applicable; NA = Not Available; W = Withheld to avoid disclosure of individual company data. |
| Release Date: 6/1/2022 |
| Next Release Date: TBD |