|
Download Data (XLS File) |
|
||||||||
|
||||||||
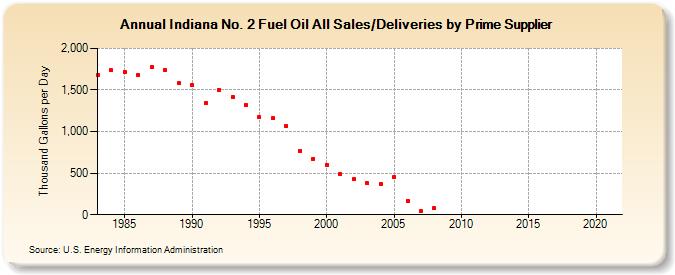
| Indiana No. 2 Fuel Oil All Sales/Deliveries by Prime Supplier (Thousand Gallons per Day) | ||||||||
| Decade | Year-0 | Year-1 | Year-2 | Year-3 | Year-4 | Year-5 | Year-6 | Year-7 | Year-8 | Year-9 |
|---|---|---|---|---|---|---|---|---|---|---|
| 1980's | 1,678.1 | 1,734.2 | 1,716.8 | 1,682.4 | 1,770.6 | 1,735.7 | 1,580.3 | |||
| 1990's | 1,560.3 | 1,342.9 | 1,504.2 | 1,414.7 | 1,318.8 | 1,172.5 | 1,157.5 | 1,067.7 | 769.8 | 674.7 |
| 2000's | 598.2 | 491.5 | 429.4 | 377.0 | 367.7 | 452.7 | 170.0 | 39.0 | 77.7 | W |
| 2010's | W | W | W | W | W | W | W | W | - | W |
| 2020's | W |
| - = No Data Reported; -- = Not Applicable; NA = Not Available; W = Withheld to avoid disclosure of individual company data. |
| Release Date: 6/1/2022 |
| Next Release Date: TBD |