|
Download Data (XLS File) |
|
||||||||
|
||||||||
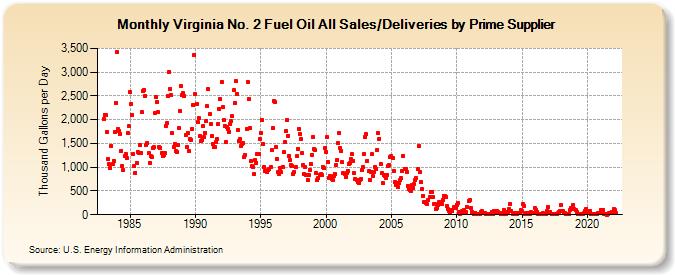
| Virginia No. 2 Fuel Oil All Sales/Deliveries by Prime Supplier (Thousand Gallons per Day) | ||||||||
| Year | Jan | Feb | Mar | Apr | May | Jun | Jul | Aug | Sep | Oct | Nov | Dec |
|---|---|---|---|---|---|---|---|---|---|---|---|---|
| 1983 | 2,008.4 | 2,107.4 | 2,089.8 | 1,738.3 | 1,162.6 | 1,062.9 | 990.5 | 1,454.8 | 1,059.4 | 1,140.3 | 1,743.7 | 2,357.5 |
| 1984 | 3,419.8 | 1,808.1 | 1,769.3 | 1,706.1 | 1,349.9 | 1,025.8 | 932.1 | 1,230.6 | 1,278.6 | 1,185.7 | 1,713.2 | 1,858.2 |
| 1985 | 2,577.7 | 2,333.1 | 2,098.3 | 1,268.3 | 1,018.7 | 886.5 | 1,091.5 | 1,325.5 | 1,300.1 | 1,477.5 | 1,305.2 | 2,152.9 |
| 1986 | 2,604.2 | 2,625.6 | 2,501.8 | 1,469.4 | 1,500.6 | 1,291.7 | 1,094.0 | 1,229.9 | 1,209.0 | 1,397.6 | 1,417.0 | 2,141.3 |
| 1987 | 2,481.1 | 2,374.6 | 2,157.4 | 1,424.0 | 1,411.9 | 1,294.1 | 1,241.1 | 1,247.8 | 1,288.2 | 1,869.1 | 1,921.3 | 2,494.7 |
| 1988 | 3,013.1 | 2,652.7 | 2,508.8 | 1,715.8 | 1,430.7 | 1,495.5 | 1,332.2 | 1,316.7 | 1,467.0 | 1,823.9 | 2,174.7 | 2,702.4 |
| 1989 | 2,525.9 | 2,551.8 | 2,498.3 | 1,673.9 | 1,427.1 | 1,723.9 | 1,348.9 | 1,591.7 | 1,573.6 | 1,809.4 | 2,314.4 | 3,353.6 |
| 1990 | 2,543.9 | 2,334.5 | 1,946.8 | 2,039.9 | 1,651.0 | 1,540.8 | 1,562.6 | 1,859.2 | 1,634.0 | 1,722.5 | 1,975.0 | 2,279.1 |
| 1991 | 2,637.7 | 2,118.9 | 1,906.0 | 1,653.5 | 1,488.9 | 1,429.0 | 1,418.8 | 1,528.7 | 1,587.7 | 1,901.0 | 2,231.0 | 2,439.5 |
| 1992 | 2,800.1 | 2,264.9 | 1,992.7 | 1,869.2 | 1,529.2 | 1,838.8 | 1,806.3 | 1,741.2 | 1,898.5 | 1,962.8 | 2,073.2 | 2,614.9 |
| 1993 | 2,355.5 | 2,818.2 | 2,546.9 | 1,788.0 | 1,554.5 | 1,587.0 | 1,449.5 | 1,486.1 | 1,504.4 | 1,204.6 | 1,260.9 | 1,807.2 |
| 1994 | 2,796.9 | 2,433.9 | 1,815.8 | 1,139.4 | 1,018.7 | 998.7 | 856.5 | 1,152.6 | 1,098.4 | 1,269.0 | 1,287.7 | 1,589.1 |
| 1995 | 1,725.7 | 1,995.0 | 1,488.8 | 995.9 | 928.0 | 921.9 | 900.3 | 935.4 | 966.7 | 1,003.0 | 1,358.7 | 1,827.2 |
| 1996 | 2,387.7 | 2,369.9 | 1,416.8 | 1,182.5 | 891.6 | 858.9 | 985.2 | 893.3 | 1,004.2 | 1,314.2 | 1,524.4 | 1,762.1 |
| 1997 | 1,997.6 | 1,663.6 | 1,233.2 | 1,144.8 | 1,047.4 | 1,024.7 | 860.7 | 898.6 | 999.8 | 1,225.6 | 1,389.0 | 1,804.5 |
| 1998 | 1,708.5 | 1,586.8 | 1,295.1 | 1,044.4 | 854.2 | 998.8 | 841.1 | 733.3 | 840.7 | 941.8 | 1,068.4 | 1,265.9 |
| 1999 | 1,638.5 | 1,378.4 | 1,361.5 | 882.4 | 723.3 | 765.6 | 842.4 | 851.2 | 834.5 | 1,002.5 | 979.5 | 1,403.7 |
| 2000 | 1,320.5 | 1,626.1 | 1,113.9 | 778.5 | 808.7 | 759.3 | 725.4 | 820.6 | 865.5 | 1,052.4 | 1,151.0 | 1,503.2 |
| 2001 | 1,724.0 | 1,409.6 | 1,344.9 | 1,100.0 | 871.1 | 849.8 | 791.0 | 885.5 | 929.2 | 1,068.9 | 1,091.4 | 1,162.5 |
| 2002 | 1,268.3 | 1,139.6 | 877.3 | 752.5 | 740.5 | 684.5 | 661.7 | 734.3 | 749.7 | 940.4 | 1,000.4 | 1,282.3 |
| 2003 | 1,633.6 | 1,695.7 | 1,130.4 | 912.5 | 732.6 | 892.2 | 1,271.4 | 806.0 | 894.7 | 1,004.5 | 966.7 | 1,371.2 |
| 2004 | 1,717.1 | 1,598.8 | 1,073.9 | 867.5 | 659.1 | 832.6 | 809.0 | 763.6 | 841.9 | 1,029.8 | 1,044.1 | 1,210.4 |
| 2005 | 1,233.0 | 1,193.4 | 923.6 | 679.0 | 633.9 | 665.7 | 577.1 | 672.9 | 735.7 | 764.1 | 929.4 | 1,240.7 |
| 2006 | 964.2 | 963.4 | 890.1 | 612.2 | 550.5 | 510.3 | 505.9 | 628.7 | 558.2 | 642.0 | 726.6 | 766.7 |
| 2007 | 952.8 | 1,439.3 | 895.1 | 693.4 | 543.4 | 400.6 | 271.2 | 275.8 | 248.4 | 221.9 | 305.1 | 362.6 |
| 2008 | 481.6 | 469.2 | 370.4 | 218.2 | 221.4 | 112.5 | 140.4 | 213.6 | 276.3 | 247.1 | 224.5 | 312.8 |
| 2009 | 394.4 | 389.7 | 374.7 | 179.5 | 114.1 | 83.2 | 63.8 | 89.1 | 80.0 | 152.3 | 137.5 | 132.7 |
| 2010 | 213.1 | 253.0 | 58.7 | 22.9 | 44.5 | 71.0 | 43.5 | 103.0 | 55.0 | 163.3 | NA | 298.9 |
| 2011 | 313.1 | 142.2 | 59.2 | 44.0 | 7.6 | 39.5 | 10.0 | W | 11.8 | 17.5 | 49.7 | 74.3 |
| 2012 | 45.2 | 46.1 | 36.4 | 13.1 | 10.8 | 11.7 | 10.2 | 12.5 | 62.2 | 17.0 | 69.3 | 41.2 |
| 2013 | 76.2 | 81.0 | 60.1 | 39.0 | 39.7 | 9.3 | 8.7 | 107.1 | 63.1 | 20.6 | 50.3 | 63.9 |
| 2014 | 119.6 | 231.2 | 75.0 | W | 17.1 | 40.2 | W | 6.8 | 44.7 | 44.2 | 31.3 | 94.6 |
| 2015 | 79.4 | 217.2 | 184.4 | 12.2 | 38.7 | 39.8 | 5.2 | 6.5 | 61.4 | 38.1 | 41.9 | 44.6 |
| 2016 | 133.1 | 102.8 | 57.7 | 10.8 | 10.1 | W | W | 26.2 | 21.4 | 12.6 | 20.4 | 80.7 |
| 2017 | 163.2 | 33.2 | 58.6 | 9.3 | 15.7 | 8.7 | 5.5 | 16.0 | 16.0 | 36.2 | 46.9 | 82.7 |
| 2018 | 195.6 | 71.8 | 38.8 | 38.1 | 5.8 | 6.3 | 16.8 | 6.5 | 95.3 | 148.5 | 130.9 | 198.5 |
| 2019 | 123.1 | 105.5 | 62.5 | 19.8 | 12.5 | 6.8 | 9.8 | 10.5 | 12.1 | 39.4 | 81.6 | 130.0 |
| 2020 | 66.9 | 62.4 | 81.4 | 14.2 | 13.0 | 11.1 | 8.8 | 11.5 | 16.3 | 19.5 | 27.6 | 42.3 |
| 2021 | 97.3 | 103.1 | 97.4 | 16.3 | 8.1 | 7.6 | 4.5 | 14.7 | 32.5 | 26.1 | 64.3 | 59.8 |
| 2022 | 120.1 | 92.1 | 32.1 | |||||||||
| - = No Data Reported; -- = Not Applicable; NA = Not Available; W = Withheld to avoid disclosure of individual company data. |
| Release Date: 5/19/2022 |
| Next Release Date: TBD |