|
Download Data (XLS File) |
|
||||||||
|
||||||||
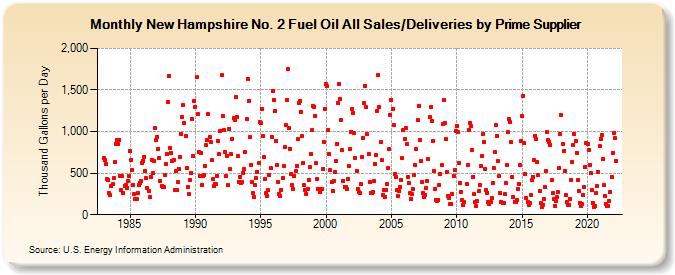
| New Hampshire No. 2 Fuel Oil All Sales/Deliveries by Prime Supplier (Thousand Gallons per Day) | ||||||||
| Year | Jan | Feb | Mar | Apr | May | Jun | Jul | Aug | Sep | Oct | Nov | Dec |
|---|---|---|---|---|---|---|---|---|---|---|---|---|
| 1983 | 682.6 | 655.0 | 609.0 | 424.8 | 419.1 | 255.1 | 232.2 | 341.1 | 366.4 | 436.2 | 632.8 | 853.8 |
| 1984 | 894.6 | 848.4 | 903.6 | 467.4 | 292.3 | 462.6 | 265.4 | 347.2 | 355.6 | 325.5 | 404.2 | 463.2 |
| 1985 | 763.6 | 662.6 | 531.8 | 358.5 | 251.2 | 187.3 | 192.3 | 255.8 | 357.0 | 384.0 | 407.6 | 626.5 |
| 1986 | 646.8 | 697.1 | 531.5 | 437.4 | 319.3 | 281.1 | 212.2 | 455.9 | 662.8 | 499.8 | 643.2 | 1,039.1 |
| 1987 | 896.2 | 937.5 | 795.5 | 679.3 | 408.0 | 345.3 | 327.6 | 332.9 | 483.0 | 614.0 | 730.6 | 1,352.6 |
| 1988 | 1,671.3 | 803.7 | 744.8 | 645.9 | 655.9 | 294.7 | 520.3 | 297.4 | 392.5 | 553.7 | 698.4 | 975.3 |
| 1989 | 1,172.8 | 1,319.1 | 1,100.9 | 941.6 | 558.1 | 337.7 | 243.6 | 422.8 | 502.3 | 1,152.3 | 702.3 | 1,372.0 |
| 1990 | 1,296.5 | 1,652.6 | 1,207.5 | 757.0 | 469.1 | 745.4 | 357.0 | 465.1 | 475.4 | 588.1 | 833.3 | 903.0 |
| 1991 | 1,208.2 | 935.4 | 880.2 | 654.2 | 426.9 | 349.4 | 366.3 | 368.2 | 465.8 | 889.2 | 725.9 | 1,010.8 |
| 1992 | 1,674.7 | 1,187.7 | 1,013.6 | 751.9 | 459.6 | 711.3 | 356.7 | 1,035.7 | 550.3 | 726.9 | 914.1 | 1,159.6 |
| 1993 | 1,143.5 | 1,418.1 | 1,180.9 | 707.6 | 395.2 | 458.4 | 381.5 | 398.1 | 499.8 | 550.2 | 750.7 | 1,151.9 |
| 1994 | 1,636.1 | 1,370.1 | 931.7 | 600.9 | 390.5 | 262.8 | 215.0 | 356.9 | 435.6 | 515.1 | 622.8 | 1,120.1 |
| 1995 | 1,101.9 | 1,274.4 | 944.9 | 688.5 | 431.5 | 261.9 | 226.2 | 291.6 | 482.1 | 558.1 | 939.8 | 1,485.9 |
| 1996 | 1,381.0 | 1,251.0 | 891.5 | 603.1 | 399.2 | 250.7 | 230.7 | 294.4 | 440.0 | 591.0 | 814.3 | 1,080.4 |
| 1997 | 1,382.5 | 1,755.8 | 1,038.7 | 796.0 | 492.1 | 353.6 | 305.9 | 470.4 | 520.2 | 588.0 | 909.3 | 1,342.1 |
| 1998 | 1,372.1 | 1,239.8 | 949.2 | 622.7 | 353.4 | 294.1 | 250.8 | 314.5 | 422.6 | 571.2 | 731.4 | 1,018.5 |
| 1999 | 1,312.2 | 1,299.5 | 1,188.0 | 617.2 | 430.7 | 307.6 | 270.0 | 311.2 | 314.6 | 547.1 | 874.5 | 1,274.2 |
| 2000 | 1,570.8 | 1,544.4 | 1,021.7 | 727.7 | 537.8 | 390.3 | 282.5 | 401.0 | 519.2 | 641.4 | 856.3 | 1,339.3 |
| 2001 | 1,571.5 | 1,392.4 | 1,143.2 | 776.9 | 411.2 | 333.7 | 327.7 | 307.2 | 427.5 | 582.5 | 789.0 | 996.6 |
| 2002 | 1,272.8 | 1,224.2 | 978.7 | 681.4 | 529.9 | 312.8 | 276.7 | 255.8 | 368.7 | 694.4 | 920.4 | 1,343.1 |
| 2003 | 1,547.3 | 1,289.9 | 965.1 | 730.3 | 398.6 | 267.1 | 255.9 | 269.7 | 400.8 | 611.1 | 723.0 | 1,250.6 |
| 2004 | 1,680.1 | 1,293.7 | 871.3 | 654.0 | 242.7 | 293.6 | 212.4 | 296.2 | 363.9 | 560.9 | 791.8 | 1,202.6 |
| 2005 | 1,379.5 | 1,266.1 | 1,078.2 | 493.6 | 456.8 | 292.1 | 228.0 | 279.7 | 337.6 | 420.6 | 682.0 | 1,013.7 |
| 2006 | 915.6 | 1,037.8 | 855.5 | 454.7 | 380.2 | 255.6 | 192.6 | 244.5 | 304.0 | 477.7 | 592.1 | 784.6 |
| 2007 | 1,141.5 | 1,308.4 | 899.8 | 643.6 | 392.6 | 265.6 | 211.2 | 242.2 | 317.0 | 407.7 | 667.1 | 1,173.7 |
| 2008 | 1,300.2 | 1,121.2 | 886.3 | 530.4 | 314.8 | 182.0 | 169.5 | 177.6 | 358.7 | 491.5 | 594.6 | 1,093.3 |
| 2009 | 1,381.6 | 1,102.9 | 905.0 | 515.9 | 226.1 | 206.0 | 123.0 | 126.9 | 246.9 | 466.2 | 535.0 | 1,012.1 |
| 2010 | 1,071.6 | 997.7 | 625.9 | 385.8 | 277.2 | 173.2 | 116.5 | 149.5 | NA | 372.7 | 598.1 | 1,022.1 |
| 2011 | 1,107.3 | 1,068.9 | 775.9 | 450.9 | 245.6 | 157.3 | 100.1 | 161.0 | 279.5 | 360.7 | 586.6 | 710.9 |
| 2012 | 966.0 | 875.2 | 544.4 | 295.9 | 266.1 | 152.7 | 126.7 | 148.5 | 201.0 | 375.4 | 558.8 | 748.3 |
| 2013 | 1,077.8 | 952.0 | 645.7 | 460.7 | 264.3 | 156.8 | 143.7 | 139.9 | 246.8 | 376.9 | 594.9 | 989.5 |
| 2014 | 1,151.8 | 1,111.8 | 872.5 | 453.8 | 219.0 | 153.7 | 158.9 | 172.5 | 310.6 | 370.0 | 597.9 | 885.2 |
| 2015 | 1,184.3 | 1,429.0 | 857.6 | 493.9 | 196.2 | 154.2 | 119.6 | 139.5 | 242.7 | 414.4 | 457.4 | 652.3 |
| 2016 | 950.6 | 914.5 | 628.2 | 472.3 | 284.8 | 139.1 | 92.3 | 122.5 | 189.7 | 335.7 | 522.3 | 990.2 |
| 2017 | 893.3 | 875.3 | 837.9 | 413.7 | 256.8 | 186.6 | 107.9 | 162.0 | 209.1 | 267.2 | 564.5 | 970.2 |
| 2018 | 1,198.9 | 854.9 | 763.5 | 524.4 | 231.8 | 147.9 | 120.9 | 119.8 | 194.2 | 413.9 | 635.4 | 838.8 |
| 2019 | 968.1 | 888.1 | 747.2 | 419.4 | 286.3 | 144.9 | 102.8 | 126.8 | 232.1 | 333.3 | 576.8 | 860.4 |
| 2020 | 849.2 | 781.9 | 602.3 | 497.8 | 298.9 | 141.0 | 95.2 | 101.5 | 257.3 | 341.9 | 515.6 | 824.8 |
| 2021 | 905.7 | 962.3 | 675.9 | 359.7 | 230.5 | 129.3 | 105.0 | 106.5 | 165.9 | 275.2 | 454.9 | 747.3 |
| 2022 | 980.9 | 918.5 | 649.3 | |||||||||
| - = No Data Reported; -- = Not Applicable; NA = Not Available; W = Withheld to avoid disclosure of individual company data. |
| Release Date: 5/19/2022 |
| Next Release Date: TBD |