|
Download Data (XLS File) |
|
||||||||
|
||||||||
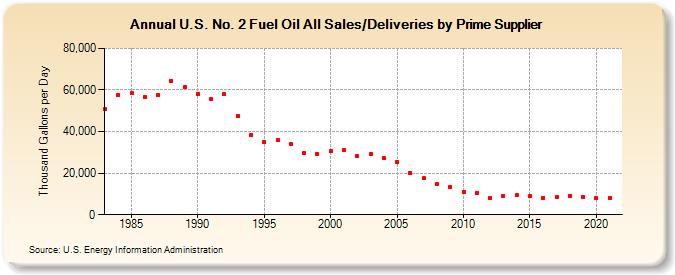
| U.S. No. 2 Fuel Oil All Sales/Deliveries by Prime Supplier (Thousand Gallons per Day) | ||||||||
| Decade | Year-0 | Year-1 | Year-2 | Year-3 | Year-4 | Year-5 | Year-6 | Year-7 | Year-8 | Year-9 |
|---|---|---|---|---|---|---|---|---|---|---|
| 1980's | 50,874.7 | 57,473.9 | 58,327.9 | 56,540.3 | 57,673.8 | 64,449.4 | 61,210.3 | |||
| 1990's | 58,217.7 | 55,627.8 | 57,891.0 | 47,383.7 | 38,247.5 | 34,877.4 | 35,749.6 | 33,883.8 | 29,702.8 | 29,315.3 |
| 2000's | 30,550.2 | 30,902.4 | 28,020.0 | 28,963.6 | 27,135.6 | 25,361.6 | 20,133.8 | 17,431.3 | 14,759.7 | 13,407.0 |
| 2010's | 11,069.8 | 10,490.7 | 8,206.3 | 9,139.4 | 9,291.3 | 8,832.8 | 8,205.1 | 8,345.5 | 9,207.8 | 8,482.9 |
| 2020's | 7,914.7 |
| - = No Data Reported; -- = Not Applicable; NA = Not Available; W = Withheld to avoid disclosure of individual company data. |
| Release Date: 6/1/2022 |
| Next Release Date: TBD |