|
Download Data (XLS File) |
|
||||||||
|
||||||||
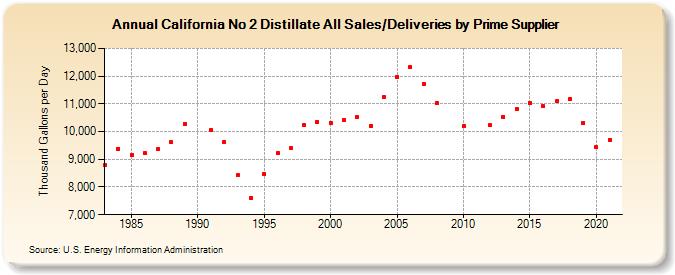
| California No 2 Distillate All Sales/Deliveries by Prime Supplier (Thousand Gallons per Day) | ||||||||
| Decade | Year-0 | Year-1 | Year-2 | Year-3 | Year-4 | Year-5 | Year-6 | Year-7 | Year-8 | Year-9 |
|---|---|---|---|---|---|---|---|---|---|---|
| 1980's | 8,780.4 | 9,388.0 | 9,148.0 | 9,213.2 | 9,362.4 | 9,613.2 | 10,276.5 | |||
| 1990's | W | 10,063.0 | 9,632.0 | 8,420.5 | 7,606.7 | 8,469.6 | 9,214.2 | 9,389.8 | 10,226.6 | 10,358.3 |
| 2000's | 10,305.7 | 10,410.3 | 10,507.7 | 10,205.2 | 11,256.0 | 11,984.3 | 12,324.1 | 11,722.6 | 11,016.7 | W |
| 2010's | 10,193.0 | W | 10,225.5 | 10,529.8 | 10,820.9 | 11,047.7 | 10,914.8 | 11,090.6 | 11,167.6 | 10,319.0 |
| 2020's | 9,428.0 |
| - = No Data Reported; -- = Not Applicable; NA = Not Available; W = Withheld to avoid disclosure of individual company data. |
| Release Date: 6/1/2022 |
| Next Release Date: TBD |