|
Download Data (XLS File) |
|
||||||||
|
||||||||
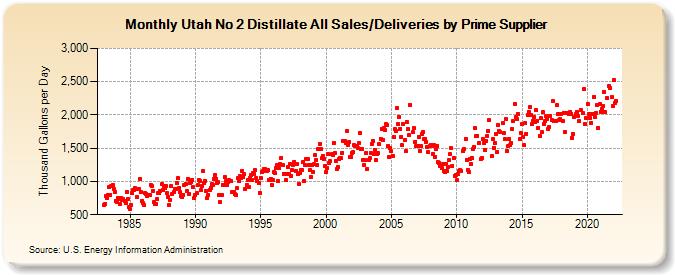
| Utah No 2 Distillate All Sales/Deliveries by Prime Supplier (Thousand Gallons per Day) | ||||||||
| Year | Jan | Feb | Mar | Apr | May | Jun | Jul | Aug | Sep | Oct | Nov | Dec |
|---|---|---|---|---|---|---|---|---|---|---|---|---|
| 1983 | 649.4 | 663.3 | 779.4 | 749.2 | 802.6 | 910.7 | 800.0 | 935.6 | 949.2 | 880.5 | 847.6 | 713.1 |
| 1984 | 687.9 | 749.4 | 738.7 | 667.9 | 752.8 | 726.5 | 736.5 | 707.0 | 677.2 | 847.5 | 738.6 | 614.1 |
| 1985 | 585.1 | 647.0 | 832.6 | 875.5 | 872.6 | 895.8 | 768.7 | 889.7 | 888.9 | 1,043.2 | 841.2 | 711.0 |
| 1986 | 670.2 | 638.6 | 825.3 | 813.0 | 774.5 | 799.6 | 792.3 | 949.1 | 925.7 | 863.9 | 685.2 | 659.9 |
| 1987 | 662.7 | 729.3 | 828.9 | 821.5 | 861.0 | 955.4 | 866.1 | 934.2 | 897.0 | 932.3 | 821.0 | 772.5 |
| 1988 | 646.4 | 721.7 | 928.5 | 817.9 | 843.7 | 884.0 | 882.3 | 973.0 | 1,046.4 | 905.7 | 840.4 | 776.8 |
| 1989 | 768.4 | 803.7 | 948.3 | 969.0 | 852.3 | 1,040.4 | 815.5 | 973.9 | 991.0 | 1,023.2 | 917.2 | 757.5 |
| 1990 | 796.5 | 824.1 | 941.8 | 1,018.5 | 1,007.5 | 869.5 | 935.0 | 1,160.6 | 972.8 | 1,004.9 | 854.9 | 755.3 |
| 1991 | 800.0 | 877.9 | 908.5 | 961.4 | 949.3 | 1,036.9 | 1,095.8 | 1,039.7 | 983.6 | 985.5 | 803.4 | 687.1 |
| 1992 | 795.1 | 951.8 | 951.9 | 1,066.2 | 1,002.2 | 946.9 | 990.4 | 1,019.9 | 1,000.2 | 1,000.4 | 848.1 | 834.1 |
| 1993 | 807.6 | 800.3 | 895.6 | 1,046.0 | 1,012.1 | 1,075.5 | 1,052.5 | 1,161.7 | 1,070.0 | 1,111.7 | 887.5 | 946.3 |
| 1994 | 1,023.6 | 915.9 | 1,053.5 | 1,094.1 | 1,016.5 | 1,132.7 | 1,118.2 | 1,165.5 | 1,051.3 | 1,002.2 | 972.3 | 830.5 |
| 1995 | 1,055.3 | 1,138.0 | 1,159.4 | 1,185.1 | 1,187.1 | 1,173.7 | 1,158.7 | 1,166.3 | 1,019.0 | 1,043.1 | 952.5 | 1,019.5 |
| 1996 | 1,139.9 | 1,119.9 | 1,204.1 | 1,252.1 | 1,003.8 | 1,201.2 | 1,262.3 | 1,354.1 | 1,243.5 | 1,119.1 | 1,108.0 | 1,016.6 |
| 1997 | 1,112.2 | 1,221.2 | 1,108.7 | 1,262.8 | 1,081.9 | 1,169.4 | 1,251.4 | 1,299.5 | 1,162.9 | 1,263.9 | 1,106.6 | 964.2 |
| 1998 | 1,130.5 | 1,164.9 | 1,171.5 | 1,285.3 | 1,005.3 | 1,243.1 | 1,343.8 | 1,339.3 | 1,243.7 | 1,168.6 | 1,071.1 | 1,241.6 |
| 1999 | 1,139.1 | 1,255.0 | 1,392.8 | 1,323.5 | 1,249.1 | 1,480.5 | 1,562.0 | 1,488.5 | 1,345.7 | 1,385.9 | 1,338.7 | 1,232.7 |
| 2000 | 1,146.9 | 1,199.2 | 1,408.4 | 1,273.3 | 1,302.1 | 1,405.8 | 1,398.4 | 1,583.8 | 1,434.7 | 1,312.1 | 1,187.6 | 1,221.0 |
| 2001 | 1,330.0 | 1,356.5 | 1,345.1 | 1,432.2 | 1,614.5 | 1,609.9 | 1,579.7 | 1,764.9 | 1,550.3 | 1,589.2 | 1,363.3 | 1,372.0 |
| 2002 | 1,432.5 | 1,440.5 | 1,547.3 | 1,527.3 | 1,527.8 | 1,502.9 | 1,575.2 | 1,733.6 | 1,488.7 | 1,491.8 | 1,315.2 | 1,254.0 |
| 2003 | 1,321.1 | 1,431.0 | 1,188.4 | 1,327.2 | 1,346.3 | 1,431.5 | 1,564.1 | 1,615.5 | 1,415.9 | 1,477.0 | 1,317.5 | 1,409.7 |
| 2004 | 1,421.1 | 1,560.3 | 1,641.9 | 1,791.1 | 1,628.1 | 1,810.4 | 1,773.9 | 1,861.1 | 1,847.9 | 1,535.1 | 1,374.9 | 1,502.3 |
| 2005 | 1,451.3 | 1,389.0 | 1,674.3 | 1,783.5 | 1,759.0 | 2,102.1 | 1,861.3 | 1,969.6 | 1,792.2 | 1,674.5 | 1,543.3 | 1,857.8 |
| 2006 | 1,621.9 | 1,452.4 | 1,897.5 | 1,785.9 | 1,694.3 | 2,153.6 | W | W | 1,736.4 | 1,797.1 | 1,600.0 | 1,536.1 |
| 2007 | 1,538.9 | 1,669.1 | 1,461.6 | 1,527.3 | 1,713.9 | 1,740.7 | 1,641.7 | 1,642.2 | 1,589.5 | 1,524.8 | 1,441.4 | 1,531.8 |
| 2008 | 1,547.8 | 1,535.5 | 1,415.7 | 1,543.7 | 1,367.7 | 1,491.6 | 1,533.9 | 1,287.4 | 1,280.5 | 1,231.7 | 1,194.9 | 1,257.8 |
| 2009 | 1,159.9 | 1,147.3 | 1,268.3 | 1,159.6 | 1,223.7 | 1,320.7 | 1,405.9 | 1,497.3 | 1,233.8 | 1,348.5 | 1,084.6 | 1,101.6 |
| 2010 | 1,017.6 | 1,116.6 | 1,163.0 | 1,170.1 | 1,160.9 | W | 1,450.2 | 1,481.6 | 1,643.5 | 1,327.8 | 1,169.9 | 1,139.4 |
| 2011 | 1,341.1 | 1,259.8 | 1,356.8 | 1,489.0 | 1,523.3 | 1,798.4 | 1,682.0 | 1,686.8 | 1,580.1 | W | 1,332.5 | 1,351.3 |
| 2012 | 1,639.3 | 1,578.0 | 1,479.5 | 1,612.7 | 1,690.4 | 1,762.4 | 1,917.9 | W | 1,380.1 | 1,640.4 | 1,507.3 | 1,578.5 |
| 2013 | 1,710.9 | 1,440.7 | 1,845.1 | 1,755.4 | 1,736.6 | W | 1,875.6 | 1,723.8 | 1,638.0 | 1,942.2 | 1,459.3 | 1,525.8 |
| 2014 | 1,643.6 | 1,540.6 | 1,581.5 | 1,785.9 | 1,904.0 | 2,169.7 | 1,970.9 | 1,933.2 | 2,020.3 | W | 1,636.3 | 1,728.0 |
| 2015 | 1,860.6 | 1,674.8 | 1,541.9 | 1,877.4 | 1,717.6 | 1,996.9 | 2,047.9 | 2,119.6 | 1,995.8 | 1,866.4 | 1,914.0 | 1,966.8 |
| 2016 | 1,894.8 | 2,069.8 | 1,910.9 | 1,809.7 | 1,686.5 | 1,948.3 | 1,739.0 | 2,038.2 | 1,861.7 | 1,902.5 | 1,984.0 | 1,942.0 |
| 2017 | 1,789.9 | 1,817.7 | 1,980.3 | 1,923.8 | 2,204.4 | 1,913.8 | 1,902.7 | 1,908.5 | 2,148.3 | 2,006.5 | 1,923.6 | 1,931.8 |
| 2018 | 2,017.3 | 1,913.7 | 2,036.2 | 1,749.0 | W | 2,033.3 | W | 2,019.4 | 2,050.8 | 2,018.5 | 1,650.1 | 1,713.2 |
| 2019 | 1,972.7 | 2,009.5 | 2,048.9 | 1,985.7 | 1,904.2 | W | 2,071.1 | W | 2,026.4 | 2,382.8 | 1,870.9 | 1,956.4 |
| 2020 | 2,169.5 | 2,010.0 | 1,961.0 | 1,884.5 | 2,007.7 | 2,011.9 | 2,274.5 | 1,966.8 | 2,030.3 | 2,152.6 | 1,804.0 | 2,160.3 |
| 2021 | 2,050.6 | 2,094.3 | 2,137.0 | 2,350.8 | 2,041.3 | W | 2,253.6 | W | 2,431.6 | 2,404.7 | 2,267.2 | 2,141.5 |
| 2022 | 2,526.2 | 2,182.6 | 2,216.7 | |||||||||
| - = No Data Reported; -- = Not Applicable; NA = Not Available; W = Withheld to avoid disclosure of individual company data. |
| Release Date: 5/19/2022 |
| Next Release Date: TBD |