|
Download Data (XLS File) |
|
||||||||
|
||||||||
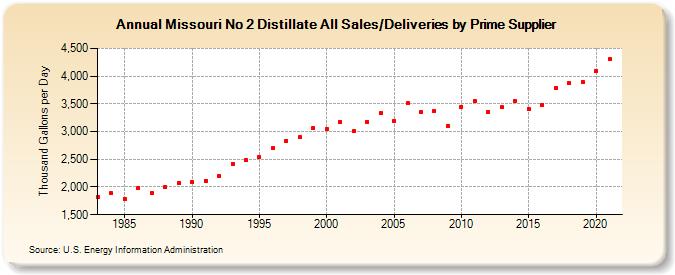
| Missouri No 2 Distillate All Sales/Deliveries by Prime Supplier (Thousand Gallons per Day) | ||||||||
| Decade | Year-0 | Year-1 | Year-2 | Year-3 | Year-4 | Year-5 | Year-6 | Year-7 | Year-8 | Year-9 |
|---|---|---|---|---|---|---|---|---|---|---|
| 1980's | 1,824.6 | 1,886.2 | 1,790.9 | 1,982.9 | 1,899.6 | 1,997.2 | 2,075.2 | |||
| 1990's | 2,087.9 | 2,113.9 | 2,206.5 | 2,420.6 | 2,483.0 | 2,538.2 | 2,703.1 | 2,831.7 | 2,893.0 | 3,063.3 |
| 2000's | 3,046.1 | 3,180.2 | 3,001.1 | 3,180.4 | 3,337.8 | 3,193.4 | 3,510.1 | 3,351.0 | 3,372.0 | 3,103.1 |
| 2010's | 3,450.8 | 3,544.5 | 3,354.8 | 3,434.5 | 3,552.8 | 3,411.2 | 3,483.6 | 3,793.3 | 3,872.3 | 3,893.3 |
| 2020's | 4,088.8 |
| - = No Data Reported; -- = Not Applicable; NA = Not Available; W = Withheld to avoid disclosure of individual company data. |
| Release Date: 6/1/2022 |
| Next Release Date: TBD |