|
Download Data (XLS File) |
|
||||||||
|
||||||||
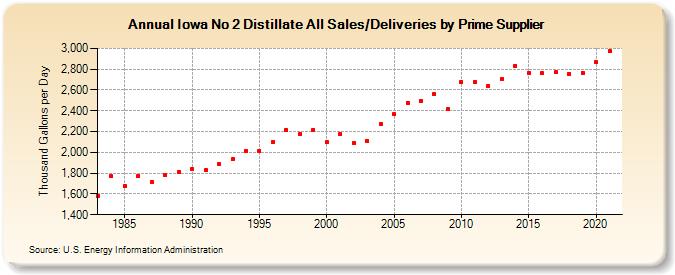
| Iowa No 2 Distillate All Sales/Deliveries by Prime Supplier (Thousand Gallons per Day) | ||||||||
| Decade | Year-0 | Year-1 | Year-2 | Year-3 | Year-4 | Year-5 | Year-6 | Year-7 | Year-8 | Year-9 |
|---|---|---|---|---|---|---|---|---|---|---|
| 1980's | 1,581.8 | 1,769.9 | 1,680.5 | 1,771.2 | 1,714.8 | 1,785.2 | 1,812.5 | |||
| 1990's | 1,835.4 | 1,829.0 | 1,885.1 | 1,932.7 | 2,014.4 | 2,013.7 | 2,100.6 | 2,215.0 | 2,175.0 | 2,215.4 |
| 2000's | 2,099.1 | 2,174.3 | 2,092.5 | 2,109.2 | 2,271.9 | 2,365.0 | 2,478.6 | 2,496.8 | 2,563.1 | 2,420.1 |
| 2010's | 2,677.4 | 2,677.3 | 2,639.3 | 2,708.2 | 2,835.4 | 2,765.7 | 2,762.6 | 2,768.5 | 2,758.0 | 2,766.5 |
| 2020's | 2,865.3 |
| - = No Data Reported; -- = Not Applicable; NA = Not Available; W = Withheld to avoid disclosure of individual company data. |
| Release Date: 6/1/2022 |
| Next Release Date: TBD |