|
Download Data (XLS File) |
|
||||||||
|
||||||||
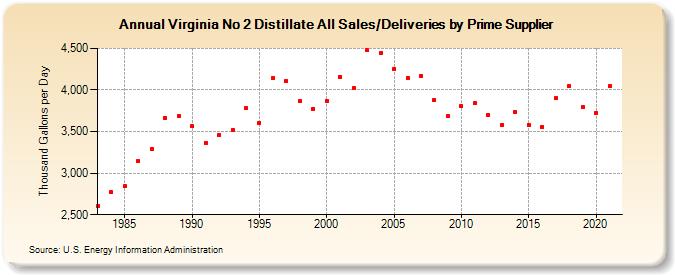
| Virginia No 2 Distillate All Sales/Deliveries by Prime Supplier (Thousand Gallons per Day) | ||||||||
| Decade | Year-0 | Year-1 | Year-2 | Year-3 | Year-4 | Year-5 | Year-6 | Year-7 | Year-8 | Year-9 |
|---|---|---|---|---|---|---|---|---|---|---|
| 1980's | 2,606.7 | 2,769.9 | 2,843.1 | 3,145.9 | 3,293.7 | 3,667.9 | 3,691.0 | |||
| 1990's | 3,561.6 | 3,367.4 | 3,459.5 | 3,518.7 | 3,778.7 | 3,605.8 | 4,145.9 | 4,108.2 | 3,861.5 | 3,776.1 |
| 2000's | 3,865.4 | 4,159.5 | 4,026.5 | 4,477.5 | 4,443.5 | 4,258.1 | 4,144.4 | 4,170.3 | 3,877.0 | 3,685.3 |
| 2010's | 3,806.4 | 3,840.0 | 3,698.3 | 3,580.1 | 3,736.8 | 3,583.6 | 3,555.3 | 3,899.9 | 4,046.7 | 3,790.7 |
| 2020's | 3,724.0 |
| - = No Data Reported; -- = Not Applicable; NA = Not Available; W = Withheld to avoid disclosure of individual company data. |
| Release Date: 6/1/2022 |
| Next Release Date: TBD |